. 2008 Feb 20;47(6):825-34.
doi: 10.1364/ao.47.000825.

Autofluorescence and diffuse reflectance spectroscopy of oral epithelial tissue using a depth-sensitive fiber-optic probe

Affiliations

Autofluorescence and diffuse reflectance spectroscopy of oral epithelial tissue using a depth-sensitive fiber-optic probe

Richard A Schwarz et al. Appl Opt. .

Abstract

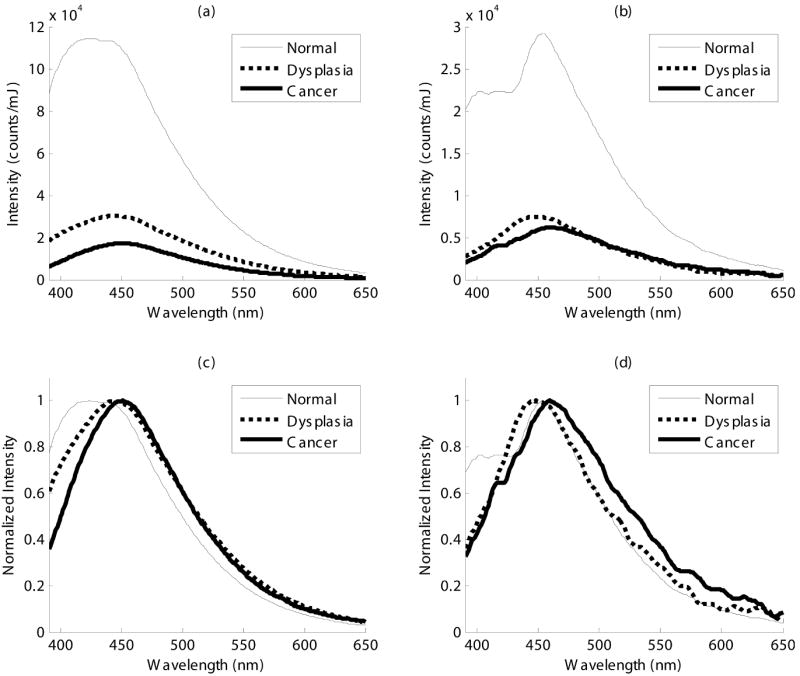
Optical spectroscopy can provide useful diagnostic information about the morphological and biochemical changes related to the progression of precancer in epithelial tissue. As precancerous lesions develop, the optical properties of both the superficial epithelium and underlying stroma are altered; measuring spectral data as a function of depth has the potential to improve diagnostic performance. We describe a clinical spectroscopy system with a depth-sensitive, ball lens coupled fiber-optic probe for noninvasive in vivo measurement of oral autofluorescence and diffuse reflectance spectra. We report results of spectroscopic measurements from oral sites in normal volunteers and in patients with neoplastic lesions of the oral mucosa; results indicate that the addition of depth selectivity can enhance the detection of optical changes associated with precancer.


Figures

Fig. 1
Fig. 1
Diagram and photograph of the clinical spectroscopy system.
Fig. 2
Fig. 2
Diagram and photograph of the clinical ball lens coupled fiber-optic probe.
Fig. 3
Fig. 3
Measured depth response of the probe and comparison with simulations: (a) measured depth response in air; (b) measured depth response in water; (c) measured depth response in water versus Monte Carlo simulated depth response for nonscattering, moderately scattering, and highly scattering media (shallow channel only).
Fig. 4
Fig. 4
Spectra measured from a single lateral tongue site in a normal volunteer using the shallow and deep channels of the probe: (a) fluorescence spectrum at 330 nm excitation; (b) fluorescence spectrum at 350 nm excitation; (c) fluorescence spectrum at 400 nm excitation; (d) diffuse reflectance spectrum under white light illumination. All spectra are shown on the same wavelength scale for comparison; the fluorescence spectrum at 400 nm excitation was collected with a 435 nm emission filter. The absorptions at 420, 540, and 580 nm in the deep channel reflectance spectrum are attributed to hemoglobin. The 420 nm hemoglobin absorption is evident in the reflectance spectra and also in several of the fluorescence spectra, particularly those collected using the deep channel.
Fig. 5
Fig. 5
Fluorescence spectra measured from three buccal sites in a single oral cancer patient at 350 nm excitation: (a) shallow channel, (b) deep channel, (c) shallow channel normalized to peak intensity value, and (d) deep channel normalized to peak intensity value. Histologic diagnoses of the three sites are, respectively, normal, moderate dysplasia, and well-differentiated invasive cancer.
Fig. 6
Fig. 6
Fluorescence spectra measured from three lateral tongue sites in a single oral cancer patient at 350 nm excitation: (a) shallow channel, (b) deep channel, (c) shallow channel normalized to peak intensity value, and (d) deep channel normalized to peak intensity value. Histologic diagnoses of the three sites are, respectively, normal, mild dysplasia, and moderately differentiated invasive cancer.

References

    1. Ries LAG, Melbert D, Krapcho M, Mariotto A, Miller BA, Feuer EJ, Clegg L, Horner MJ, Howlader N, Eisner MP, Reichman M, Edwards BK, editors. SEER cancer statistics review, 1975–2004. National Cancer Institute; Bethesda, Md: based on November 2006 SEER data submission, posted to the SEER web site, 2007, http://seer.cancer.gov/csr/1975_2004/
    1. Parkin DM, Bray F, Ferlay J, Pisani P. Global cancer statistics, 2002. Ca-Cancer J Clin. 2005;55:74–108. - PubMed
    1. Neville BW, Day TA. Oral cancer and precancerous lesions. Ca-Cancer J Clin. 2002;52:195–215. - PubMed
    1. Poh CF, Zhang L, Anderson DW, Durham JS, Williams PM, Priddy RW, Berean KW, Ng S, Tseng OL, MacAulay C, Rosin MP. Fluorescence visualization detection of field alterations in tumor margins of oral cancer patients. Clin Cancer Res. 2006;12:6716–6722. - PubMed
    1. Gillenwater A, Papadimitrakopoulou V, Richards-Kortum R. Oral premalignancy: new methods of detection and treatment. Curr Oncol Rep. 2006;8:146–154. - PMC - PubMed

Publication types

MeSH terms