

Long-term effects of traffic-related air pollution on mortality in a Dutch cohort (NLCS-AIR study)
- PMID: 18288318
- PMCID: PMC2235230
- DOI: 10.1289/ehp.10767
Long-term effects of traffic-related air pollution on mortality in a Dutch cohort (NLCS-AIR study)
Abstract
Background: Several studies have found an effect on mortality of between-city contrasts in long-term exposure to air pollution. The effect of within-city contrasts is still poorly understood.
Objectives: We studied the association between long-term exposure to traffic-related air pollution and mortality in a Dutch cohort.
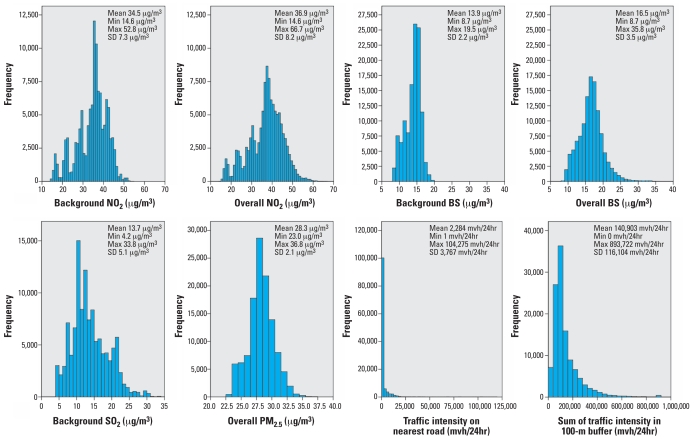
Methods: We used data from an ongoing cohort study on diet and cancer with 120,852 subjects who were followed from 1987 to 1996. Exposure to black smoke (BS), nitrogen dioxide, sulfur dioxide, and particulate matter < or = 2.5 microm (PM(2.5)), as well as various exposure variables related to traffic, were estimated at the home address. We conducted Cox analyses in the full cohort adjusting for age, sex, smoking, and area-level socioeconomic status.
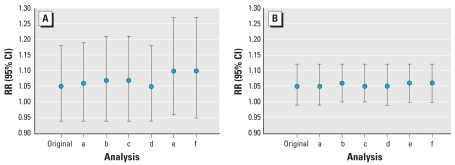
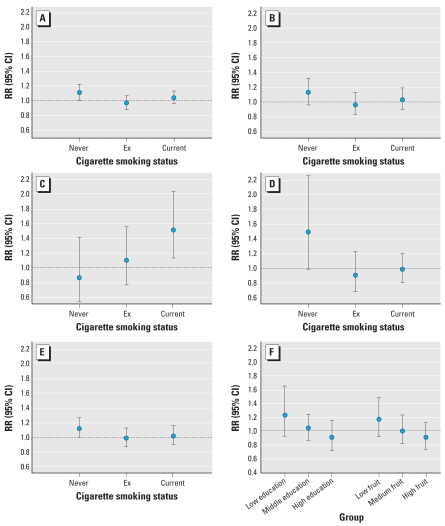
Results: Traffic intensity on the nearest road was independently associated with mortality. Relative risks (95% confidence intervals) for a 10-microg/m(3) increase in BS concentrations (difference between 5th and 95th percentile) were 1.05 (1.00-1.11) for natural cause, 1.04 (0.95-1.13) for cardiovascular, 1.22 (0.99-1.50) for respiratory, 1.03 (0.88-1.20) for lung cancer, and 1.04 (0.97-1.12) for mortality other than cardiovascular, respiratory, or lung cancer. Results were similar for NO(2) and PM(2.5), but no associations were found for SO(2).
Conclusions: Traffic-related air pollution and several traffic exposure variables were associated with mortality in the full cohort. Relative risks were generally small. Associations between natural-cause and respiratory mortality were statistically significant for NO(2) and BS. These results add to the evidence that long-term exposure to ambient air pollution is associated with increased mortality.
Keywords: air pollution; cohort; mortality; traffic.
Figures
References
-
- Abbey DE, Nishino N, McDonnell WF, Burchette RJ, Knutsen SF, Beeson WL, et al. Long-term inhalable particles and other air pollutants related to mortality in nonsmokers. Am J Respir Crit Care Med. 1999;159:373–382. - PubMed
-
- Beelen R, Hoek G, Fischer P, van den Brandt PA, Brunekreef B. Estimated long-term outdoor air pollution concentrations in a cohort study. Atmos Environ. 2007;41:1343–1358.
-
- Brunekreef B, Holgate ST. Air pollution and health. Lancet. 2002;360:1233–1242. - PubMed
-
- de Hollander AEM, Hoeymans N, Melse JM, van Oers JAM, Polder JJ. Care for Health: Public Health Forecast 2006 [Zorg voor gezondheid. Volksgezondheid Toekomst Verkenning 2006] Houten: Bohn Stafleu Van Loghum; 2006.
-
- DerSimonian R, Laird N. Meta-analysis in clinical trials. Control Clin Trials. 1986;7:177–188. - PubMed
MeSH terms
Substances
LinkOut - more resources
Full Text Sources
Other Literature Sources