Comparative Study
. 2008 Apr;37(4):770-80.
doi: 10.1016/j.mcn.2008.01.001. Epub 2008 Jan 17.

Integrin regulation of cytoplasmic calcium in excitatory neurons depends upon glutamate receptors and release from intracellular stores

Affiliations
Comparative Study

Integrin regulation of cytoplasmic calcium in excitatory neurons depends upon glutamate receptors and release from intracellular stores

C-Y Lin et al. Mol Cell Neurosci. 2008 Apr.

Abstract

Integrins regulate cytoplasmic calcium levels ([Ca(2+)]i) in various cell types but information on activities in neurons is limited. The issue is of current interest because of the evidence that both integrins and changes in [Ca(2+)]i are required for Long-Term Potentiation. Accordingly, the present studies evaluated integrin ligand effects in cortical neurons. Integrin ligands or alpha5beta1 integrin activating antisera rapidly increased [Ca(2+)]i with effects greater in glutamatergic than GABAergic neurons, absent in astroglia, and blocked by beta1 integrin neutralizing antisera and the tyrosine kinase antagonist genistein. Increases depended upon extracellular calcium and intracellular store release. Ligand-induced effects were reduced by voltage-sensitive calcium channel and NMDA receptor antagonists, but blocked by tetrodotoxin or AMPA receptor antagonists. These results indicate that integrin ligation triggers AMPA receptor/depolarization-dependent calcium influx followed by intracellular store release and suggest the possibility that integrin modulation of activity-induced changes in [Ca(2+)]i contributes importantly to lasting synaptic plasticity in forebrain neurons.


Figures

Figure 1
Figure 1. The integrin ligand RGD stimulates rapid increases in [Ca2+]i
Dissociated cortical/hippocampal neurons were treated with RGD or the control YIGSR peptide and effects on cytoplasmic calcium levels were evaluated by Fura2 ratiometric imaging. (A-D) Photomicrographs of a group of cells showing (A-C) pseudocolor ratiometric imaging of [Ca2+]i (colors denote calcium levels with red>orange>yellow>blue) and (D) the same field as seen under Differential Interference Contrast (DIC; Calibration bar = 10 μm). Images show [Ca2+]i in cells before treatment (A, CON) and after treatment with 10 μM RGD (B) and 10 μM YIGSR (C): in this set, RGD was applied 20 min after YIGSR washout. (A,B) RGD increased [Ca2+]i in most cells (arrows) although some did not respond (arrowhead) whereas (C) YIGSR had no detectable effect on [Ca2+]i. (E) Graph shows the perikaryal [Ca2+]i for 6 cells in a single microscopic field over time: 10 μM RGD was applied twice during intervals indicated by horizontal lines at top; the fluorescence increase over baseline (CF= Fx-Fo) is plotted on the Y axis. (F, G) Graphs show quantification of [Ca2+]i (F) at 30 sec intervals before and after 10 μM RGD or YIGSR application at time “zero” and (G) mean levels during the baseline, pretreatment period (CON) and at the latency to the initial peak RGD response (mean ± SEM values shown for 36 RGD- and 22 YIGSR- treated cells over 4 experiments; ***p<0.001 vs. CON, Tukey’s Multiple Comparison Test, TMT). (H) Bar graph shows effects (mean ± SEM) of RGD dose on [Ca2+]i as assessed at the latency to the initial peak increase (n ≥ 48 cells/group across ≥ 3 experiments). For all three doses, [Ca2+]i were significantly different from control values (p<0.001, TMT); *p<0.05 for comparison of 10 μM and 1 mM values, TMT.
Figure 2
Figure 2. RGD effects on [Ca2+]i are mediated by ß1 integrins
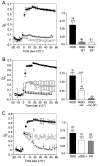
Plots of [Ca2+]i as determined by Fura2 imaging shows the effects of integrin ligand and neutralizing antibody treatment as assessed every 30 sec with 10 μM RGD applied at time zero (at left) and at the latency to the initial peak RGD-alone effect (at right). For each panel, the grey tones on the bar graph, denoting the different treatment groups, corresponds the symbol fill tones on the corresponding time plot; e.g., in each results for the RGD treatment group are plotted with a black fill tone. Numbers over bars indicate the total number cells evaluated over ≥4, 3 and ≥5 experiments in A, B and C , respectively: in each instance the CON group included ≥ 109 cells. In this and subsequent illustrations, control values represent baseline (pretreatment) [Ca2+]i measures for the same cells later evaluated following drug treatment: mean control values were subtracted from all groups for bar graphs; statistical analyses were run on the raw data. (A) Cultures were treated with RGD alone or in the presence of one of two ß1 integrin neutralizing antisera (-ß1 = AB555002; -ß1’ = AB1987Z; applied 10 min before and during RGD treatment). Both ß1 antisera completely blocked RGD effects on [Ca2+]i (***p<0.001 vs. control values, TMT). (B) Cultures were treated with RGD alone, RGD plus neutralizing αv integrin antisera (-αv), or RGD plus both anti-αv and anti-ß1 (-αv,-ß1) antisera: anti-αv attenuated, and the combination of anti-αv and anti-ß1 neutralizing antisera blocked, effects of RGD treatment (***p<0.001, **p<0.01 vs. control, TMT). (C) Cultures were treated with RGD, fibronectin fragment (FN, 50 μg/ml) or α5ß1 integrin activating antibody (α5ß1+) at time zero; all three treatments significantly increased [Ca2+]i (***p<0.001 vs. control, TMT).
Figure 3
Figure 3. RGD increases [Ca2+]i in glutamatergic and GABAergic neurons
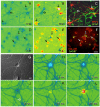
(A-F) Double labeling immunocytochemistry was used to identify cells with RGD-induced increases in [Ca2+]i. Panels A-C show calcium imaging before (A, CON) and after (B, RGD) RGD treatment for cells subsequently processed for localization of MAP2 and GFAP immunoreactivities. As shown, RGD increased calcium levels of MAP2-ir neurons (arrows, red label in C) but not GFAP-ir astroglial cells (open arrows, green label in C). (D-F) Panels D-E show [Ca2+]i before (D) and after (E) RGD treatment for cells subsequently processed for localization of VGLUT1-ir and GAD67-ir (F): RGD increased [Ca2+]i in both VGLUT1-ir glutamatergic neurons (arrows, red label in F) and, to lesser extent, in GAD67-ir GABAergic cells (open arrows, green label in F) (Calibration bar in F = 20 μm for A-F). (G-L) Photomicrographs H-I show Fura2 imaging of [Ca2+]i in the same microscopic field over time after local (microspritzer) application of RGD into the bath slightly to the right of the central neuron (seen in DIC in G); RGD was applied at time zero, the latency to each photograph is indicated in the lower right. As shown with the shift to yellow and then red labeling, [Ca2+]i levels are increased in the processes of this cell at 2 sec (I) and in the soma at 60 sec (K) after RGD treatment. At 300 sec (L) calcium levels are still highly elevated in the soma but have declined in the processes. Calibration bar = 10 μm in G for G-L.
Figure 4
Figure 4. RGD effects on [Ca2+]i depend upon Ca2+ influx, but include release from intracellular stores
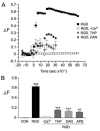
Plots show Fura2 determination of perikaryal [Ca2+]i in dissociated cortical/hippocampal neurons (A) over time (RGD applied at time zero; measures at 30 sec intervals) and (B) at the latency to the initial peak RGD-induced increase for cells treated with 10 μM RGD in normal calcium containing medium (RGD), in calcium free medium (-Ca2+) and in the presence of 10 μM thapsigargin (THP), 10 μM dantrolene (DAN) or 200 μM 2-APB (APB). As shown, dantrolene, 2-APB and thapsigargin attenuated, and calcium free medium blocked, RGD effects on [Ca2+]i (mean ± SEM values; n ≥ 40/experimental group and n=171 controls over 5 experiments; ***p<0.001 and **p<0.01 vs. CON, TMT; p<0.001 for RGD vs. RGD with Ca2+-free medium, DAN, APB or THP, TMT).
Figure 5
Figure 5. RGD effects on [Ca2+]i depend on glutamate receptor and VSCC activities
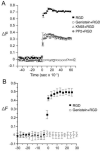
Panels A and B show effects of RGD on [Ca2+]i over time, alone and in the presence of (A) voltage sensitive calcium channel (VSCC) blockers and the NMDAR antagonist APV and (B) AMPAR antagonists. (A) Nifedipine (10 μM, Nif/RGD), Gd3+ (20 μM, GD3+/RGD) and APV (20 μM) attenuated RGD effects on [Ca2+]i. (B) CNQX (10 μM) and GYKI (100 μM) completely blocked RGD-induced increase in [Ca2+]i while the Ca2+ permeable AMPAR antagonist JsTx (10 μM) had a modest effect. (C) Bar graph shows effects of all of the above antagonists, and TTX, on RGD-induced increases in [Ca2+]i as assessed at the latency to the initial peak RGD effect (from the same experiments illustrated in A and B); numbers over bars denote number of cells evaluated over 4-5 experiments for each group; CON group mean represents mean baseline measures for cells prior to RGD application (mean ± SEM shown; ***p<0.001 vs. CON, TMT; values for RGD treatment alone were significantly greater than those for all other drug treatment groups at p<0.001 excepting the JsTx/RGD group which was not significantly different, TMT).
Figure 6
Figure 6. RGD-induced changes in [Ca2+]i are kinase-dependent
Plots show Fura2 determination of perikaryal [Ca2+]i in dissociated cortical/hippocampal neurons over time with 10 μM RGD (RGD) applied alone or the presence of kinase antagonists including, in A, PP2 (10 μM), KN93 (5 μM), PD98059 (50 μM) and K252a (200 nM), and genistein (200 μM) and, in B, genistein at 10 μM. In each instance the antagonist was applied to the bath 10 min prior to the addition of RGD at time zero. Control measures (CON) were obtained during the baseline recording period prior to drug treatment: values plotted are group means ± SEM for (A) n ≤ 23 cells/RGD group and n=140 for CON and (B) n ≤ 13 cells/group. When applied with RGD, each antagonist significantly reduced initial peak [Ca2+]i levels as compared to those attained with RGD treatment alone (p<0.001, TMT). All RGD+antagonist treatment group measures were significantly different from CON values (p<0.001, TMT) with the exception of the RGD+genistein groups (p>0.05 vs CON in A and B).
Figure 7
Figure 7. RGD-induced increases in pGluR1 are blocked by genistein
Dissociated cortical/hippocampal neurons were treated with normal media (“CON”), 10 μM RGD alone, or 10 μM RGD in combination with genistein (GN; 200 μM) and were then processed for western blot analysis of pGluR1 Ser831 levels using phospho-specific antisera. (A) Western blots from a representative experiment show that, relative to control levels, 3 and 10 min RGD treatments increased pGluR1 Ser831-ir (top) but not total GluR1 (middle) levels; levels of actin-ir (bottom) show relatively equal amounts of protein were loaded on each lane. (B) Western blot shows that increases in pGluR1 Ser831 induced by 10 min RGD treatment were blocked by genistein. (C) Bar graph shows quantification of pGluR1 Ser831 band densities across from 4 experiments as illustrated in B (mean ± SEM optical density values shown): RGD reliably increased pGluR1 (p = 0.029, one way ANOVA; *p<0.05 for comparison to CON, TMT post hoc test) and that this effect was blocked by genistein cotreatment.

Similar articles

Cited by

References

    1. Bardo S, Cavazzini MG, Emptage N. The role of the endoplasmic reticulum Ca2+ store in the plasticity of central neurons. Trends Pharmacol Sci. 2006;27:78–84. - PubMed
    1. Bernard-Trifilo JA, Kramár EA, Torp R, Lin C-Y, Pineda EA, Lynch G, Gall CM. Integrin signaling cascades are operational in adult hippocampal synapses and modulate NMDA receptor physiology. J Neurochem. 2005;93:834–849. - PubMed
    1. Bhattacharya S, Ying X, Fu C, Patel R, Kuebler W, Greenberg S, Battacharya J. αvß3 integrin induces tyrosine phosphorylation-dependent Ca++ influx in pulmonary endothelial cells. Circ Res. 2000;86:456–462. - PubMed
    1. Bi X, Lynch G, Zhou J, Gall CM. Polarized distribution of α5 integrin in the dendrites of hippocampal and cortical neurons. J. Comp. Neurol. 2001;435:184–193. - PubMed
    1. Blaschke M, Keller BU, Rivosecchi R, Hollmann M, Heinemann S, Konnerth A. A single amono acid determines the subunit-specific spider toxin block of α-amino-3-hydroxy-5-methylisoxazole-4-propionate/kainate receptor channels. Proc Natl Acad Sci U S A. 1993;90:6528–6532. - PMC - PubMed

Publication types