. 2008 Apr 15;40(3):1116-29.
doi: 10.1016/j.neuroimage.2007.12.061. Epub 2008 Jan 15.

A vascular anatomical network model of the spatio-temporal response to brain activation

Affiliations

A vascular anatomical network model of the spatio-temporal response to brain activation

David A Boas et al. Neuroimage. .

Abstract

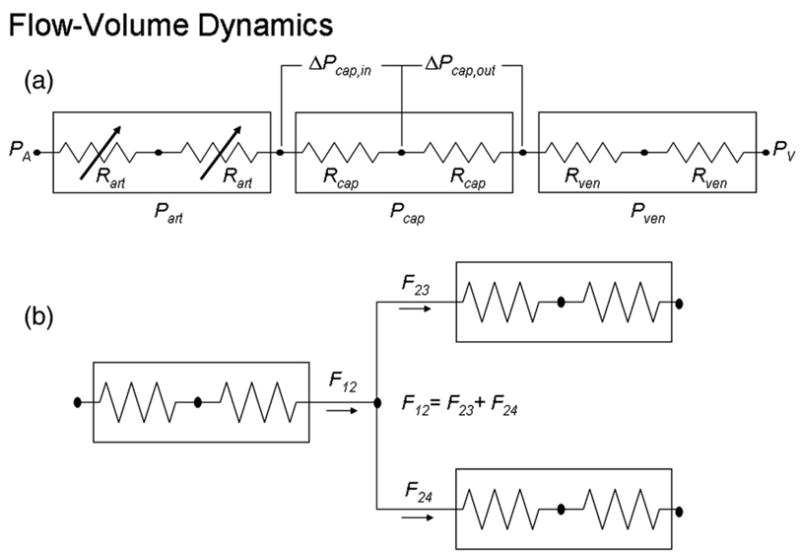
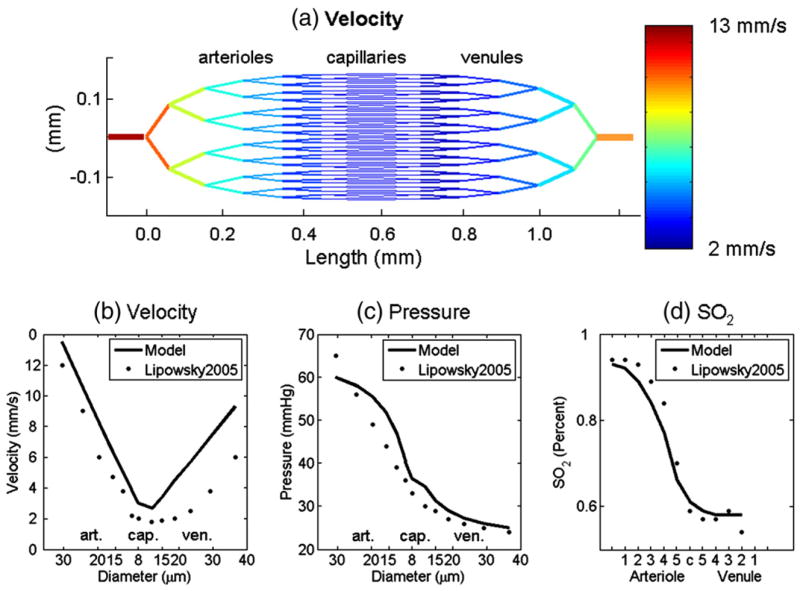
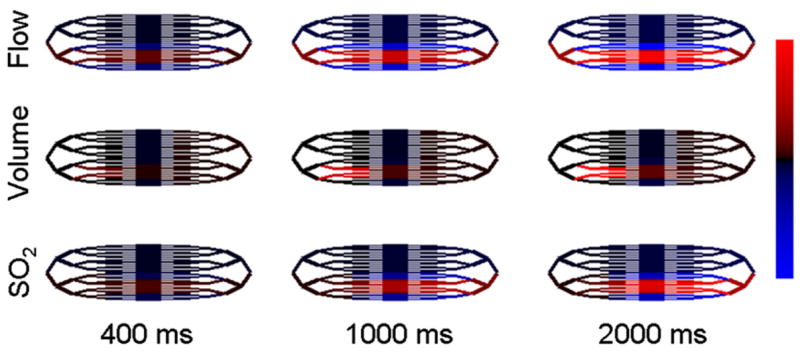
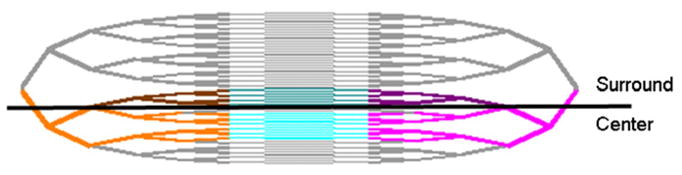
Neuronal activity-induced changes in vascular tone and oxygen consumption result in a dynamic evolution of blood flow, volume, and oxygenation. Functional neuroimaging techniques, such as functional magnetic resonance imaging, optical imaging, and PET, provide indirect measures of the neural-induced vascular dynamics driving the blood parameters. Models connecting changes in vascular tone and oxygen consumption to observed changes in the blood parameters are needed to guide more quantitative physiological interpretation of these functional neuroimaging modalities. Effective lumped-parameter vascular balloon and Windkessel models have been developed for this purpose, but the lumping of the complex vascular network into a series of arterioles, capillaries, and venules allows only qualitative interpretation. We have therefore developed a parallel vascular anatomical network (VAN) model based on microscopically measurable properties to improve quantitative interpretation of the vascular response. The model, derived from measured physical properties, predicts baseline blood pressure and oxygen saturation distributions and dynamic responses consistent with literature. Furthermore, the VAN model allows investigation of spatial features of the dynamic vascular and oxygen response to neuronal activity. We find that a passive surround negative vascular response ("negative BOLD") is predicted, but that it underestimates recently observed surround negativity suggesting that additional active surround vasoconstriction is required to explain the experimental data.


Figures

Fig. 1
Fig. 1
Diagram of the resistor network representing the vascular network.
Fig. 2
Fig. 2
Diagram of oxygen dynamics.
Fig. 3
Fig. 3
(a) Our 2D vascular network model and the velocity in each segment calculated from the arterial–venial pressure difference and the resistance of each vascular segment. (b) Velocity, (c) pressure in different diameter segments, and (d) hemoglobin oxygen saturation in different vascular branches agree well with experimental measurements from Lipowsky (2005) and Vovenko (1999). From left to right are arterioles, capillaries, and venules.
Fig. 4
Fig. 4
We plot (a, d) velocity and (b, e) pressure in different diameter segments, and (c, f) hemoglobin oxygen saturation in different vascular branches. In the first row, results are shown for increasing the length of the arterioles by 50% (blue line), the length of the venules by 50% (red line), and the length of both by 50% (green line). In the second row, results are shown for decreasing (red line) and increasing (blue line) the diameter of the arterioles and venules. For the blue (red) line the vessel diameter is increased by 25% (10%) at each branch level away from the capillaries compared with the black line in which the diameter increases by 20% at each branch level. In both rows, the black line shows the result for the original lengths and diameters (same as Fig. 3).
Fig. 5
Fig. 5
We graph the relative changes in flow, volume, and SO2 in response to localized arteriole dilation. Red indicates an increase and blue indicates a decrease. Flow changes range from −0.22% to 2.2%. Volume changes range from −0.26% to 2.6%. SO2 changes range from −0.11% to 1.1%.
Fig. 6
Fig. 6
Plotted are the relative hemodynamic responses to arteriole dilation in the arterioles, capillaries, and venules in the center ROI (solid lines) and the surround ROI (dashed lines), as absolute (top row) and relative changes (bottom row). The regions of interest (ROIs) are defined in Fig. 7. Note the surround decrease in flow in all vascular compartments and the surround negativity in oxy- and deoxy-hemoglobin in the capillaries and venules. The surround (dashed lines) has been magnified by a factor of 10.
Fig. 7
Fig. 7
This figure indicates the different regions of interest over which the hemodynamic parameters were averaged. The bright orange, cyan, and magenta indicate the vessel segments averaged for the arterioles, capillaries, and venules, respectively, in the center of the activated region. The darker orange, cyan, and magenta indicate the regions averaged for the surrounding arterioles, capillaries, and venules, respectively.
Fig. 8
Fig. 8
These plots show the modulation of oxy- and deoxy-hemoglobin in each vascular compartment by increases in the rate of oxygen consumption. The solid, dashed, dot-dashed, and dotted lines represent the responses to 0, 0.5%, 1%, and 1.5% increases in oxygen consumption. In all cases, there is a 1.3% increase in arteriole diameter.
Fig. 9
Fig. 9
The first row shows hemoglobin responses to a transient arteriole dilation (solid lines) and a transient increase in CMRO2 (dashed lines) for each vascular compartment. The second row shows the hemoglobin responses to combined arteriole dilation and CMRO2 increase (dot-dashed lines) compared to an arteriole dilation only (solid line).
Fig. 10
Fig. 10
The model (solid lines) is compared with the experimentally measured (dots) changes in hemoglobin concentrations in the center (a) and surround (b) of the rat barrel cortex. The model responses are averaged over the arteriole, capillary, and venule compartments. The dashed lines in (b) are the model responses from the capillary compartment only.

References

    1. Albeck MJ, Borgesen SE, Gjerris F, Schmidt JF, Sorensen PS. Intracranial pressure and cerebrospinal fluid outflow conductance in healthy subjects. J Neurosurg. 1991;74:597–600. - PubMed
    1. Alperin NJ, Lee SH, Loth F, Raksin PB, Lichtor T. MR-intracranial pressure (ICP): a method to measure intracranial elastance and pressure noninvasively by means of MR imaging: baboon and human study. Radiology. 2000;217:877–885. - PubMed
    1. Ances BM, Wilson DF, Greenberg JH, Detre JA. Dynamic changes in cerebral blood flow, O2 tension, and calculated cerebral metabolic rate of O2 during functional activation using oxygen phosphorescence quenching. J Cereb Blood Flow Metab. 2001;21:511–516. - PubMed
    1. Behzadi Y, Liu TT. An arteriolar compliance model of the cerebral blood flow response to neural stimulus. Neuroimage. 2005;25:1100–1111. - PubMed
    1. Boas DA, Strangman G, Culver JP, Hoge RD, Jasdzewski G, Poldrack RA, Rosen BR, Mandeville JB. Can the cerebral metabolic rate of oxygen be estimated with near-infrared spectroscopy? Phys Med Biol. 2003;48:2405–2418. - PubMed

Publication types

LinkOut - more resources