. 2008 Mar 28;377(3):706-14.
doi: 10.1016/j.jmb.2008.01.067. Epub 2008 Feb 2.

Single-molecule atomic force spectroscopy reveals that DnaD forms scaffolds and enhances duplex melting

Affiliations

Single-molecule atomic force spectroscopy reveals that DnaD forms scaffolds and enhances duplex melting

Wenke Zhang et al. J Mol Biol. .

Abstract

The Bacillus subtilis DnaD is an essential DNA-binding protein implicated in replication and DNA remodeling. Using single-molecule atomic force spectroscopy, we have studied the interaction of DnaD and its domains with DNA. Our data reveal that binding of DnaD to immobilized single molecules of duplex DNA causes a marked reduction in the 'end-to-end' distance of the DNA in a concentration-dependent manner, consistent with previously reported DnaD-induced looping by scaffold formation. Native DnaD enhances partial melting of the DNA strands. The C-terminal domain (Cd) of DnaD binds to DNA and enhances partial duplex melting but does not cause DNA looping. The Cd-mediated melting is not as efficient as that caused by native DnaD. The N-terminal domain (Nd) does not affect significantly the DNA. A mixture of Nd and Cd fails to recreate the DNA looping effect of native DnaD but produces exactly the same effects as Cd on its own, consistent with the previously reported failure of the separated domains to form DNA-interacting scaffolds.


Figures
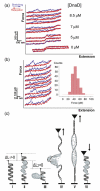
Fig. 1
Fig. 1
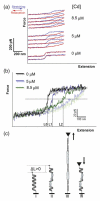
The effects of native DnaD on the nanomechanical properties of DNA. (a) Representative extension/relaxation curves of DNA in the presence of increasing concentrations of DnaD (0 to 8.5 μM), as indicated. (b) Repeated manipulation of the same DNA molecule in the presence of 8.5 μM DnaD. The stretching curves (blue) show a sawtooth pattern; the relaxation curves are shown in red. The histogram shows the statistical analysis of the force distributions of the sawtooth-like early peaks. (c) A schematic model to explain the effects of DnaD on the double helix of the DNA. DnaD binds to DNA and untwists the duplex to a paranemic form (I to II). As the concentration increases it forms a scaffold (II to III). The changes in the end-to-end length relative to the naked duplex are indicated. As the DNA is pulled the scaffold is disrupted (IV), the duplex melts (V), while the protein remains bound to DNA as it is relaxed (VI). For clarity the force curves in (a) and (b) have been arrayed on top of each other along the y-axis. The apparent ‘shift’ of the bottom curves with naked DNA in (a) is due to the relative point where the pulling has started. The naked DNA has been pulled even further along the x-axis to ensure that no hysteresis due to pulling was apparent. Scale bars along the y- and x-axes indicate the absolute force (piconewtons) and length (nanometers), respectively.
Fig. 2
Fig. 2
The effects of Cd on the nanomechanical properties of DNA. (a) Representative extension (blue) and relaxation (red) curves of DNA in the presence of increasing concentrations of Cd (0 to 8.5 μM), as indicated. (b) Superposition of typical stretching (dark colours) and equivalent relaxation (light colours) curves of the same DNA in the presence of different concentrations of Cd (0, 5, 8.5 μM). The increase of the contour length (L2>L1>L0) and the hysteresis between the stretching and equivalent relaxation curves in the presence of increasing concentrations of Cd indicate the untwisting effects of Cd on the DNA duplex. (c) A schematic model to explain the effects of Cd on the DNA double helix. Cd binds to DNA and untwists the duplex, converting it from plectonemic to paranemic (I to II). The change in the apparent end-to-end length relative to naked DNA is indicated. As the DNA is extended, melting of the duplex takes place (III) and the protein remains attached to the DNA as it is relaxed (IV). For clarity, the force curves in (a) and (b) have been arrayed on top of each other along the y-axis. Scale bars along the y- and x-axes indicate the absolute force (piconewtons) and length (nanometers), respectively.
Fig. 3
Fig. 3
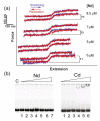
(a) The effects of Nd on the nanomechanical properties of DNA. Representative extension (blue) and relaxation (red) curves obtained in the presence of increasing concentrations of Nd, as indicated. No clear hysteresis was apparent, indicating no significant interaction with the DNA. In the presence of high concentrations of Nd (7 and 8.5 μM) the force plateau shifts slightly below the plateau of the naked DNA (F1>F2, F3). This is attributed to a weak interaction of Nd with the DNA, as explained in the text. For clarity the force curves have been arrayed on top of each other along the y-axis. Scale bars along the y- and x-axes indicate the absolute force (piconewtons) and length (nanometers), respectively. (b) Band shift assays of Cd and Nd with dsDNA. A 32P-radiolabelled 261-bp dsDNA fragment was used to compare binding of Cd and Nd to DNA. Binding reactions were carried out in the presence of increasing concentrations of Nd (lanes 1–7: 0.1, 0.5, 1.0, 10, 20, 30, 50 μM, respectively) and Cd (lanes 1–6: 0.1, 0.5, 1.0, 10, 20, 30 μM, respectively) and resolved by non-denaturing polyacrylamide gel electrophoresis, as indicated. Only Cd exhibited binding to dsDNA.
Fig. 4
Fig. 4
Comparison of the effects of native DnaD and its domains on the nanomechanical properties of DNA. All the force curves were normalized and superposed for direct comparison. L1–L4 indicate the relative end-to-end length of dsDNA in the presence (L1, L3, L4) or absence (L2) of native DnaD and its separate domains. L1 indicates the apparent end-to-end length of dsDNA due to scaffold formation in the presence of native DnaD, while L4 indicates the end-to-end length due to duplex untwisting by native DnaD. L3 indicates the relative end-to-end length of dsDNA in the presence of Cd (or Cd + Nd).
Fig. 5
Fig. 5
Band shift assays of DnaD, Cd and SSB. (a) Comparative gel shift assays with a radioactively labelled 34mer single-stranded oligonucleotide and increasing concentrations of SSB, DnaD (lanes 1–6 correspond to 0.05, 0.1, 0.5, 1, 2 and 5 μM, respectively) or Cd (lanes 1–6 correspond to 0.1, 0.5, 1.0, 10, 20 and 30 μM, respectively), as indicated. (b) Comparative gel shift assays with a radioactively labelled 261-bp double-stranded fragment of DNA and increasing concentrations of SSB and DnaD (lanes 1–7 correspond to 0.01, 0.05, 0.1, 0.5, 1, 2 and 5 μM, respectively), as indicated. Lanes labelled C show controls with the labelled DNA substrates in the absence of protein. SSB has a higher affinity for ssDNA than DnaD. The main lower shifted SSB band corresponds to a tetramer bound to DNA with a higher shifted band appearing at higher [SSB] corresponding to two SSB tetramers bound to the DNA. By contrast, DnaD binds to dsDNA whilst SSB does not. Cd has much lower affinity for ssDNA than DnaD.
Fig. 6
Fig. 6
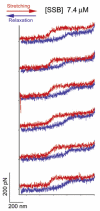
The effects of SSB on the nanomechanical properties of DNA. Representative extension (red) and relaxation (blue) curves at 7.4 μM SSB. Hysteresis is apparent, suggesting that with our DNA molecule and under our experimental conditions single-strand regions along the S-DNA are exposed to SSB. However, a qualitative comparison with similar curves in the presence of Cd shown in Fig. 2a indicate that hysteresis with SSB is weaker than hysteresis with Cd. Scale bars along the y- and x-axes indicate the absolute force (piconewtons) and length (nanometers), respectively.

References

    1. Smith SB, Finzi L, Bustamante C. Direct mechanical measurements of the elasticity of single molecules by using magnetic beads. Science. 1992;258:1122–1126. - PubMed
    1. Bensimon D. Force: a new structural control parameter? Structure. 1996;4:885–889. - PubMed
    1. Strick TR, Allemand J-F, Bensimon D, Bensimon A, Croquette V. The elasticity of a single supercoiled DNA molecule. Science. 1996;271:1835–1837. - PubMed
    1. Strick TR, Allemand JF, Bensimon D, Croquette V. Stress-induced structural transition in DNA and proteins. Annu. Rev. Biophys. Biomol. Struct. 2000;29:523–543. - PubMed
    1. Bustamante C, Bryant Z, Smith SB. Ten years of tension: single-molecule DNA mechanics. Nature. 2003;421:423–427. - PubMed

Publication types

MeSH terms

LinkOut - more resources