. 2008 Mar 4;105(9):3593-8.
doi: 10.1073/pnas.0712231105. Epub 2008 Feb 21.

Large-scale model of mammalian thalamocortical systems

Affiliations

Large-scale model of mammalian thalamocortical systems

Eugene M Izhikevich et al. Proc Natl Acad Sci U S A. .

Abstract

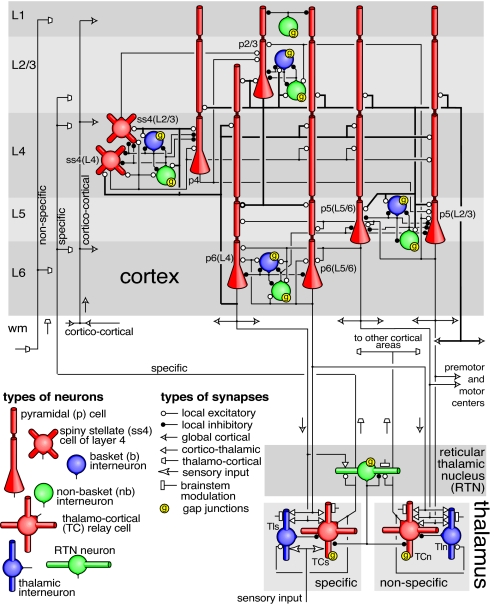
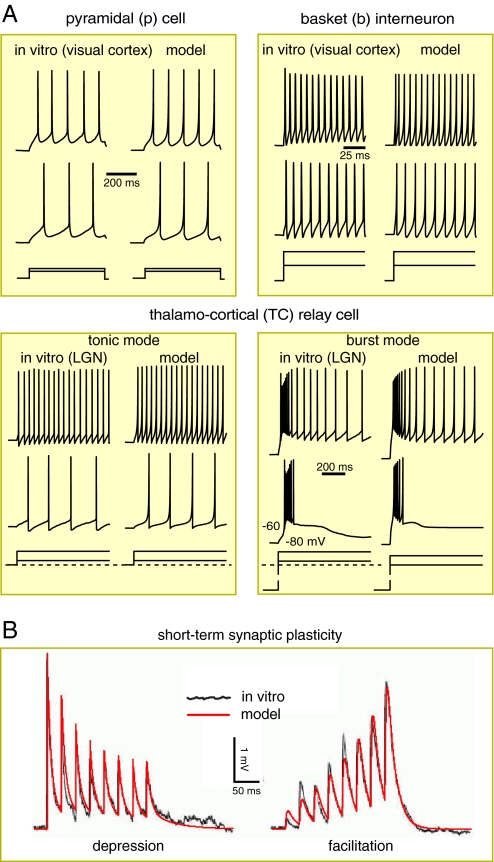
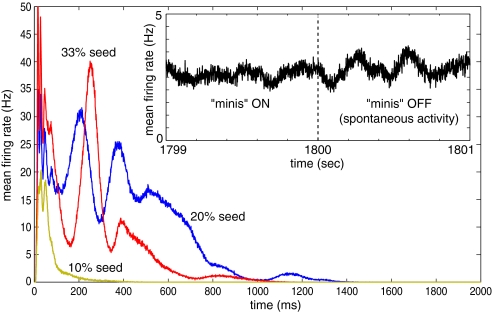
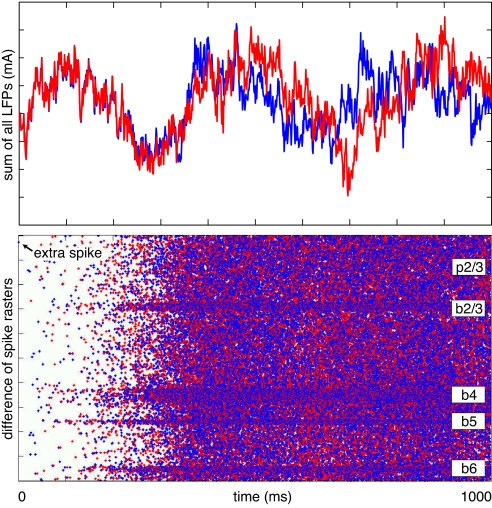
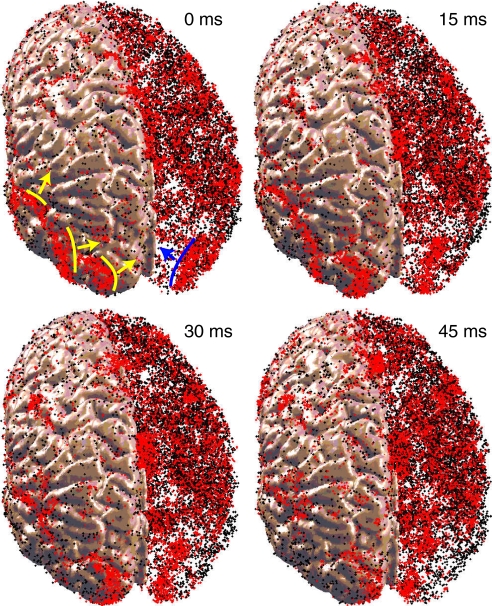
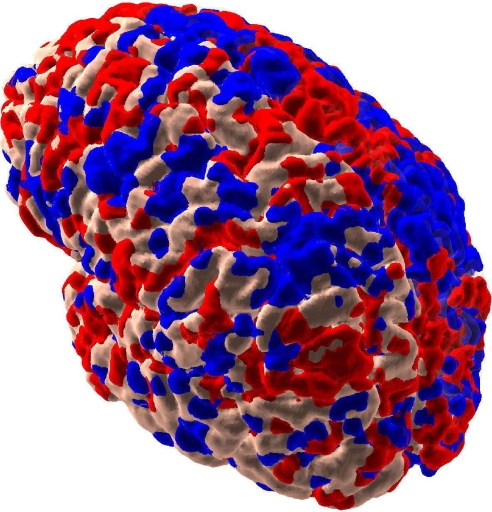
The understanding of the structural and dynamic complexity of mammalian brains is greatly facilitated by computer simulations. We present here a detailed large-scale thalamocortical model based on experimental measures in several mammalian species. The model spans three anatomical scales. (i) It is based on global (white-matter) thalamocortical anatomy obtained by means of diffusion tensor imaging (DTI) of a human brain. (ii) It includes multiple thalamic nuclei and six-layered cortical microcircuitry based on in vitro labeling and three-dimensional reconstruction of single neurons of cat visual cortex. (iii) It has 22 basic types of neurons with appropriate laminar distribution of their branching dendritic trees. The model simulates one million multicompartmental spiking neurons calibrated to reproduce known types of responses recorded in vitro in rats. It has almost half a billion synapses with appropriate receptor kinetics, short-term plasticity, and long-term dendritic spike-timing-dependent synaptic plasticity (dendritic STDP). The model exhibits behavioral regimes of normal brain activity that were not explicitly built-in but emerged spontaneously as the result of interactions among anatomical and dynamic processes. We describe spontaneous activity, sensitivity to changes in individual neurons, emergence of waves and rhythms, and functional connectivity on different scales.


Conflict of interest statement

The authors declare no conflict of interest.

Figures

Fig. 1.
Fig. 1.
The model's global thalamocortical geometry and white matter anatomy was obtained by means of diffusion tensor imaging (DTI) of a normal human brain. In the illustration, left frontal, parietal, and a part of temporal cortex have been cut to show a small fraction of white-matter fibers, color-coded according to their destination.
Fig. 2.
Fig. 2.
Simplified diagram of the microcircuitry of the cortical laminar structure (Upper) and thalamic nuclei (Lower). Neuronal and synaptic types are as indicated. Only major pathways are shows in the figure. Complete details are provided in SI Appendix. L1-L6 are cortical layers; wm refers to white-matter. Arrows indicate types and directions of internal signals.
Fig. 3.
Fig. 3.
Firing patterns and short-term synaptic plasticity. (A) Comparisons of four representative firing patterns recorded in vitro (Left columns) and simulated (Right columns) using the phenomenological model (1,2). Different neuronal types have different values of parameters; see SI Appendix. (B) Comparison of short-term synaptic plasticity recorded in vitro (black noisy curve; modified from figure 4 of ref. 16) and simulated (red smooth curve) by the model (3).
Fig. 4.
Fig. 4.
Spontaneous activity in the model. Main graph: Activity (shown as mean firing rate in the network) dies out within the first few seconds of simulation regardless of the number of seed spikes introduced at the beginning of the simulation. (Inset) The model was simulated with a source of noisy input (spontaneous synaptic release, or “minis”) during the first 1,800 s; after the source of noise was turned off, the activity persisted.
Fig. 5.
Fig. 5.
Sensitivity of the model to the addition of a single spike: two simulations starting from the same initial condition, except for a single spike, diverge (Upper) within half a second. (Lower) Shown is the difference of two spike rasters corresponding to the two simulations. Blue or red dots correspond to extra or missing spikes, respectively. For the sake of clarity, we show a simulation of a smaller network (100,000 neurons). Horizontal stripes correspond to the activity of basket cells, which typically fire with much higher frequency than the other neurons.
Fig. 6.
Fig. 6.
Propagating waves in the model. Red (black) dots are spikes of excitatory (inhibitory) neurons. The right hemisphere is transparent to expose the waves inside the cortex (snapshots are from SI Movie 2).
Fig. 7.
Fig. 7.
Intrinsic correlations of fMRI signal between the seed cortical region in a location corresponding to posterior cingulate [data not shown; see Fox et al. (5)] and other regions in the model brain. Red (blue) voxels correspond to positive (negative) correlations (>1 standard deviation of correlations of all voxels to the seed region). The right hemisphere is transparent so that inside voxels are visible.

References

    1. Lumer ED, Edelman GM, Tononi G. Neural dynamics in a model of the thalamocortical system. I. Layers, loops and the emergence of fast synchronous rhythms. Cereb Cortex. 1997;7:207–227. - PubMed
    1. Lumer ED, Edelman GM, Tononi G. Neural dynamics in a model of the thalamocortical system. II. The role of neural synchrony tested through perturbations of spike timing. Cereb Cortex. 1997;7:228–236. - PubMed
    1. Markram H. The blue brain project. Nat Rev Neurosci. 2006;7:153–160. - PubMed
    1. Nunez PL, Srinivasan R. Electric Fields of the Brain: The Neurophysics of EEG. 2nd Ed. New York: Oxford Univ Press; 2006.
    1. Fox MD, et al. The human brain is intrinsically organized into dynamic, anticorrelated functional networks. Proc Natl Acad Sci USA. 2005;102:9673–9678. - PMC - PubMed

Publication types

LinkOut - more resources