Randomized Controlled Trial
. 2008 Mar;118(3):1085-98.
doi: 10.1172/JCI32830.

Growth hormone enhances thymic function in HIV-1-infected adults

Affiliations
Randomized Controlled Trial

Growth hormone enhances thymic function in HIV-1-infected adults

Laura A Napolitano et al. J Clin Invest. 2008 Mar.

Abstract

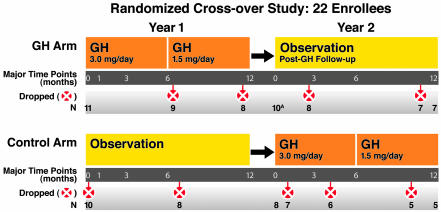
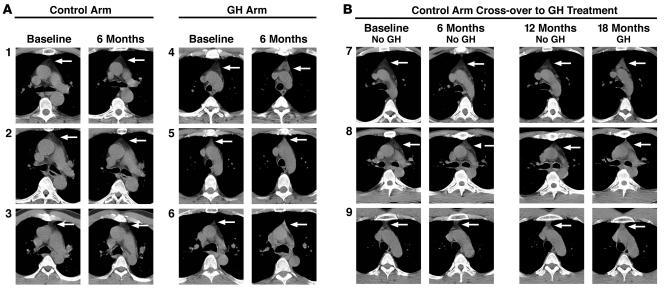
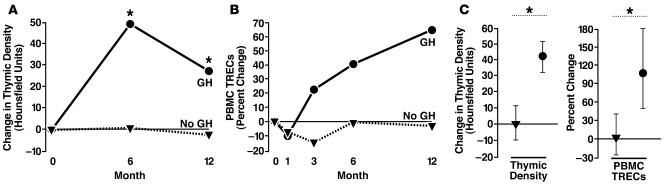
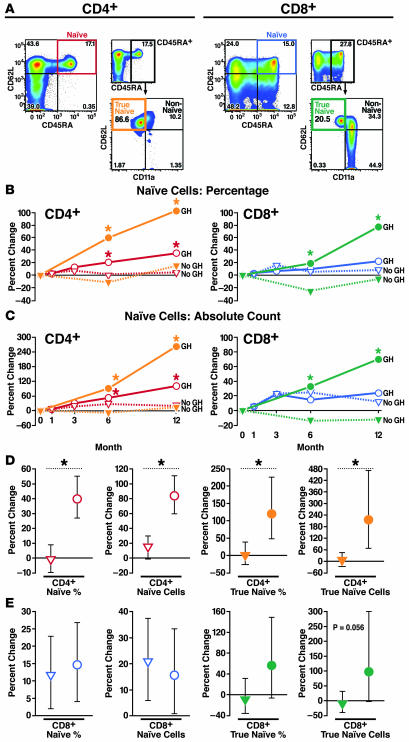
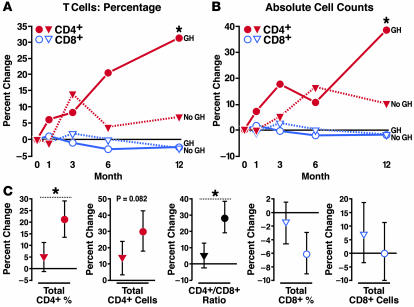
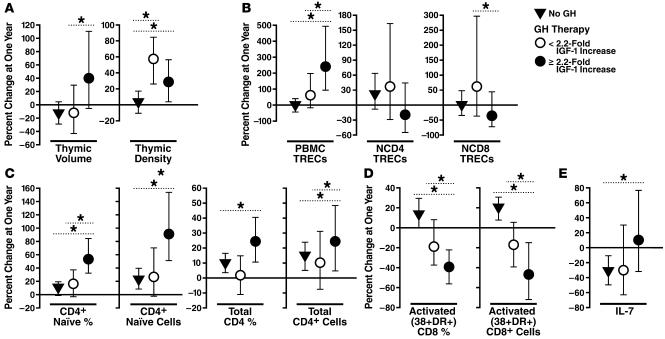
Growth hormone (GH) is an underappreciated but important regulator of T cell development that can reverse age-related declines in thymopoiesis in rodents. Here, we report findings of a prospective randomized study examining the effects of GH on the immune system of HIV-1-infected adults. GH treatment was associated with increased thymic mass. In addition, GH treatment enhanced thymic output, as measured by both the frequency of T cell receptor rearrangement excision circles in circulating T cells and the numbers of circulating naive and total CD4(+) T cells. These findings provide compelling evidence that GH induces de novo T cell production and may, accordingly, facilitate CD4(+) T cell recovery in HIV-1-infected adults. Further, these randomized, prospective data have shown that thymic involution can be pharmacologically reversed in humans, suggesting that immune-based therapies could be used to enhance thymopoiesis in immunodeficient individuals.


Figures

Figure 1
Figure 1. Study design: prospective, randomized, open-label crossover study.
The two-year study design is depicted. Eleven participants each were randomized either to receive GH for 1 year (3.0 mg GH subcutaneous injection daily for 6 months, then 1.5 mg daily for 6 months) while continuing their usual ARV (GH Arm); or to continue usual ARV for 1 year and then cross over to GH treatment and ARV in the second year (Control Arm). Unscheduled changes in GH treatment (premature dose reduction, temporary interruption, or permanent discontinuation) were made by the study investigators as indicated for management of AEs. Major time points, number of participants, and details of dropped participant data from the indicated arm are shown. Additional details of study design and data exclusion can be found in Methods. ATwo GH arm participants who terminated GH early (after month 6) were followed for 1 year after GH. These data are included in 1-year-post-GH follow-up.
Figure 2
Figure 2. GH treatment is associated with the emergence of dense thymus tissue in HIV-1–infected adults.
Representative scans are shown for 9 study participants (numbered 1–9). (A) Cross-sectional comparison of thymus scans from 3 control arm participants (1–3, left panel, no GH) and 3 GH arm participants (4–6, right panel, GH) during the first 6 months of the study. All baseline scans showed low attenuation grayish black adipose tissue in the anterior mediastinum (arrows), consistent with thymic involution. Repeat CT scans obtained 6 months after the baseline scans revealed a marked increase in thymic density in GH recipients (far-right column). This brighter higher-attenuation tissue is consistent with cellular thymus. In contrast, no changes were observed in the absence of GH (second column from left). (B) Longitudinal display of serial thymus CT scans from 3 control arm participants (nos. 7–9) taken at study baseline; 6 months into the study in the absence of GH; pre-GH baseline 12 months into the study; and 18 months into the study after 6 months of GH treatment. As seen in the cross-sectional comparisons, thymus is involuted in the absence of GH, and GH treatment (far-right column) is associated with the emergence of dense thymus tissue.
Figure 3
Figure 3. GH treatment is associated with increased thymic density and TREC frequency in HIV-1–infected adults.
(A) Comparison of changes in the GH arm versus the control arm over the first year of the study demonstrated significant increases in thymic density in GH recipients at 6 and 12 months after GH initiation. A modest, nonsignificant decrease in thymic density was observed between month 6 and month 12, commensurate with GH dose reduction and consistent with a dose-response effect of GH on the thymus. No notable changes in thymic density were seen in the absence of GH. (B) The frequency of PBMC TRECs was also increased with GH treatment during the first year of the study. (C) Comprehensive regression analysis, including crossover data of GH treatment of observational controls, demonstrates that GH treatment (circles) is associated with significant increases in thymic density and PBMC TREC frequency compared with no GH. Estimated changes with 95% CIs are displayed. Regression analysis estimated the effects of 6 months (thymic density) or 1 year (PBMC TRECs) of GH treatment compared with changes in the absence of GH. Median values are displayed in A and B. CIs and additional data are shown in Tables 2 and 3. *P < 0.05 for comparison of GH versus no GH.
Figure 4
Figure 4. GH treatment is associated with increases in naive T cells in HIV-1–infected adults.
(A) Representative phenotypic analysis of CD4+ and CD8+ naive T cells by flow cytometry. CD11a staining was used to identify a subset of non-naive CD45RA+CD62L+CD11abright T cells and a subset of true naive CD45RA+CD62L+CD11adim T cells. Higher percentages of CD45RA+CD62L+ non-naive T cells were observed among CD8+ T cells. (B and C) Comparison of changes in the GH arm versus observational controls over the first year of the study demonstrated significant increases in the percentage (B, left) and absolute count (C, left) of NCD4 (red) and TNCD4 (orange) cells. There were no increases in the percentage (B, right) and small, nonsignificant increases in the absolute count (C, right) of NCD8 cells (blue) in the GH arm (compared with observational controls) over the first year of the study. TNCD8 (green) increased significantly over the first year of the study in the GH arm. (D) GH-associated increases (circles) in NCD4 cells were confirmed by regression analysis including GH treatment data from observational controls. (E) GH-associated increases (circles) in TNCD8 cells trended toward statistical significance in comprehensive regression analysis. Estimated changes with 95% CIs are shown. Regression analysis estimated the effects of 1 year of GH treatment compared with changes over 1 year in the absence of GH. Median values are shown in B and C. CIs and additional data are shown in Tables 2 and 3. *P < 0.05 for comparison of GH versus no GH.
Figure 5
Figure 5. GH treatment is associated with increases in total CD4+ T cells in HIV-1–infected adults.
Comparison of changes in the GH arm versus the observational control arm over the first year of the study showed that GH treatment was associated with significant increases in the percentage (A) and absolute count (B) of CD4+ T cells (red). (C) Comprehensive regression analysis, including crossover data of GH treatment in observational controls, showed that GH treatment (circles) was associated with significant increases in CD4+ T cell percentage and the CD4+/CD8+ T cell ratio when compared with no GH. Increases in the absolute count of CD4+ T cells trended toward statistical significance in this analysis. There were no remarkable GH-associated changes in the percentage or absolute count of CD8+ T cells. Estimated changes with 95% CIs are shown. Regression analysis estimated the effects of 1 year of GH treatment compared with changes over 1 year in the absence of GH. Median values are shown in A and B. CIs and additional data are shown in Tables 2 and 3. *P < 0.05 for comparison of GH versus no GH.
Figure 6
Figure 6. Increases in circulating IGF-1 are associated with immunologic changes in GH-treated HIV-1–infected adults.
Regression analysis data revealed that changes in naive and total CD4+ T cells (C), activated CD8+CD38+DR+ cells (D), and circulating IL-7 levels (E) are associated with GH-induced increases in IGF-1. (B) Higher levels of IGF-1 appear to increase the frequency of PBMC TRECs but decrease the frequency of naive T cell TRECs. (A) GH treatment increased thymic density regardless of IGF-1 gain; however, higher gains in IGF-1 were associated with increased thymic volume. These results suggest that IGF-1 mediates several GH effects on the human immune system. Estimated changes with 95% CIs are shown. Analysis estimated the effects of 1 year of GH. *P < 0.05 for indicated comparisons.

Comment in

Similar articles

Cited by

References

    1. Connors M., et al. HIV induces changes in CD4+ T-cell phenotype and depletions within the CD4+ T-cell repertoire that are not immediately restored by antiviral or immune-based therapies. Nat. Med. 1997;3:533–540. - PubMed
    1. Teixeira L., et al. Poor CD4 T cell restoration after suppression of HIV-1 replication may reflect lower thymic function. AIDS. 2001;15:1749–1756. - PubMed
    1. Lecossier D., Bouchonnet F., Schneider P., Clavel F., Hance A.J. Discordant increases in CD4+ T cells in human immunodeficiency virus-infected patients experiencing virologic treatment failure: role of changes in thymic output and T cell death. J. Infect. Dis. 2001;183:1009–1016. - PubMed
    1. Kaufmann G.R., et al. The extent of HIV-1-related immunodeficiency and age predict the long-term CD4 T lymphocyte response to potent antiretroviral therapy. AIDS. 2002;16:359–367. - PubMed
    1. Kaufmann G.R., et al. CD4 T-lymphocyte recovery in individuals with advanced HIV-1 infection receiving potent antiretroviral therapy for 4 years: the Swiss HIV Cohort Study. Arch. Intern. Med. 2003;163:2187–2195. - PubMed

Publication types

Substances