. 2008 May;56(7):775-90.
doi: 10.1002/glia.20652.

Complex rectification of Müller cell Kir currents

Affiliations

Complex rectification of Müller cell Kir currents

Yuriy V Kucheryavykh et al. Glia. 2008 May.

Abstract

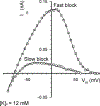
Although Kir4.1 channels are the major inwardly rectifying channels in glial cells and are widely accepted to support K+- and glutamate-uptake in the nervous system, the properties of Kir4.1 channels during vital changes of K+ and polyamines remain poorly understood. Therefore, the present study examined the voltage-dependence of K+ conductance with varying physiological and pathophysiological external [K+] and intrapipette spermine ([SP]) concentrations in Müller glial cells and in tsA201 cells expressing recombinant Kir4.1 channels. Two different types of [SP] block were characterized: "fast" and "slow." Fast block was steeply voltage-dependent, with only a low sensitivity to spermine and strong dependence on extracellular potassium concentration, [K+]o. Slow block had a strong voltage sensitivity that begins closer to resting membrane potential and was essentially [K+]o-independent, but with a higher spermine- and [K+]i-sensitivity. Using a modified Woodhull model and fitting i/V curves from whole cell recordings, we have calculated free [SP](in) in Müller glial cells as 0.81 +/- 0.24 mM. This is much higher than has been estimated previously in neurons. Biphasic block properties underlie a significantly varying extent of rectification with [K+] and [SP]. While confirming similar properties of glial Kir and recombinant Kir4.1, the results also suggest mechanisms underlying K+ buffering in glial cells: When [K+]o is rapidly increased, as would occur during neuronal excitation, "fast block" would be relieved, promoting potassium influx to glial cells. Increase in [K+]in would then lead to relief of "slow block," further promoting K+-influx.


Figures

Fig. 1.
Fig. 1.
Complex rectification of Kir currents in glial Müller cells. A: Recordings from an amphibian (frog, Rana pipiens) retinal glial Müller cell. Rapid loss of rectification (relief of endogenous block) is observed in the Müller cell during time-dependent washout of the cytoplasm by a patch pipette without spermine (SP). The i/V curves have been transformed from double curved shape (white and black arrowheads) to almost linear in ~110 s demonstrating complete block relief by dialysis. The cell had a membrane potential of −60 mV in [K+]o = 5 mM and was clamped at a holding potential of −50 mV. The dotted line shows zero current. Stimulation was achieved by voltage ramps (the protocol is shown). B: Recordings from a Long Evans rat Müller cell. Left panel: Biphasic rectification (black and white arrowheads) in a cell dialyzed with 0.1 mM SP in control solution (control, wash) and in a solution containing the TASK channel blocker bupivacaine (0.2 mM). Stimulation was achieved by voltage ramps (the protocols are shown). Each curve represents an average of four responses to ramp stimuli. Pronounced biphasic rectification denoted by white and black arrowheads was observed in “control” and in “wash” recordings. The biphasic block became more evident when linear “leakage currents” through 2P-domain TASK channels were depressed by bupivacaine. The cell had a membrane potential of −86 mV in [K+]o = 3 mM and was clamped at a holding potential of −50 mV. Dotted lines show zero current. Right panel: Recording from the same cell as in left panel using the same protocol. Nearly complete block of all K+-currents were observed in the solution containing bupivacaine 0.2 mM and Ba2+ 0.2 mM to block both TASK and Kir channels, respectively. The curve represents ten averaged recordings. C: Recordings from Sprague-Dawley rat Müller cells, dialyzed with 0, 0.03 and 0.3 mM SP in the patch pipette showing that both, the level of rectification and biphasic type of rectification, depend upon the SP concentration in the cytoplasm established after 120 s of cell dialysis. White arrowheads point to residual rectification that is in physiological area, near the resting membrane potential of glial cells. Rectification disappeared after longer dialysis without SP (also shown in Fig. 2). Dotted lines show zero current. The cells (from left to right) had membrane potentials of −77, −70, and −76 mV and were clamped at −50 mV in [K+]o = 5 mM. The protocol is shown and the first records were obtained 30 s after cell opening (ex. black arrowhead) and repeated each 30 s. Note: even 300 μM SP has less blocking effect than endogenous block (first ramp response in right recording, black arrowhead), showing that probably the concentration of free endogenous SP in freshly isolated cells is much higher than 300 μM. The model used to fit i/V curves (see methods) predicts that the free concentration of SP in these cells is 0.80 ± 0.24 mM (n = 6).
Fig. 2.
Fig. 2.
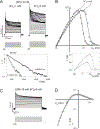
Different voltage-jump protocols (short and long) induce block of K+ current by [SP]i through frog Müller cell Kir channels that develop with different kinetics. A: Recording after 5 min of cytoplasmic dialysis with zero [SP]i. Left panel: Traces of K+ current induced by brief (80 ms) depolarizing voltage-steps with an increment of 10 mV (the short protocol) that start from −60 mV and reach the maximal depolarization of 280 mV recorded in [K+]o = 10 mM. Complete relief of block is established. Right panel: Traces of K+ current induced by long (8 s) depolarizing voltage-jumps with an increment of 10 mV (the long protocol) that start from −100 mV and reach the maximal depolarization of 290 mV recorded in [K+]o = 10 mM. The i/V relationship is near linear. B: Recording in the presence of 0.3 mM [SP]i. Left panel: Traces of K+ current induced by brief (80 ms) depolarizing voltage-steps with an increment of 5 mV depolarizing voltage-steps (the short protocol) that start from −60 mV and reach the maximal depolarization of 240 mV recorded in [K+]o = 10 mM. For illustrative purposes currents recorded in an intermediate voltage range within which the i/V relationship is linear were omitted from this panel. Right panel: Traces of K+ current induced by long (8 s) depolarizing voltage-jumps with an increment of 5 mV (the long protocol) that start from −100 mV and reach the maximal depolarization of 140 mV recorded in [K+]o = 10 mM. C: Current-voltage (i/V) relationships measured at the end of depolarizing pulses. Triangles, measurements from recordings illustrated in B (left panel with [SP]in 0.3 mM). Circles, measurements from recordings illustrated in B (right panel). Notice that both protocols eventually block of the same fraction of total current (dotted line). The residual currents below dotted line are due to spermine insensitive K+ current likely via 2-domain pore potassium channels (Skatchkov et al., 2006) and other channels. Black arrowhead represents fast block while white arrowhead points to slow block. D: The i/V relationships shown in B corrected for the fraction of K+ current which was not blocked and, presumably determined by K+ channels that are not sensitive to intracellular SP, like tandem-pore domain (TASK-1 and TASK-2) K+ channels (see Discussion). Triangles show the short protocol measurements and circles show the long protocol measurements. Solid lines are fits to the data with the block parameters K50 (0) and Ve (the value of voltage shift which causes the e-fold change of K50 (0)) of 17966 M and −8.1 mV (low affinity (fast) block, black arrowhead), and 0.47 mM and −37.3 mV (high affinity (slow) block, white arrowhead) for short and long protocols, respectively. All data were obtained from the same experiment.
Fig. 3.
Fig. 3.
Dependence of block of K+ current through the frog Müller cell Kir channels by intracellular SP induced by the fast protocol. A: i/V relationships normalized to the maximal current (Imax) value obtained in the presence of 5 mM [K+]o and different [SP]i. Arrows denote the maximal current amplitude in the i/V relationships. Circles, the i/V curve in the presence of 0.1 mM SP. Squares, the i/V curve in the presence of 1 mM [SP]i. Upward triangles, the i/V curve in the presence of 10 mM SP. Solid lines are fits of the data points with K50 (0) and Ve equal to 712.9 M and −10.0 mV, 324.8 M, and −10.1 mV, and 297.8 M and −11.0 mV for 0.1 mM, 1 mM and 10 mM [SP]i, respectively. The same i/V curves represented in the absolute current scale (Im, nA) are shown in the box. Data for each of [SP]i-s were obtained from different experiments. B: Dependence of the rate of block onset induced by the short protocol on [SP]i and membrane potential in the presence of 5 mM [K+]o. Each point represents the mean value of two measurements on different cells. Filled circles show measurements at 220 mV; filled downward triangles at 200 mV; filled squares at 180 mV. Straight lines are linear regressions through the data points (the slope of regression lines indicates the rate constant of SP binding to the open channel (kon)).
Fig. 4.
Fig. 4.
Slow, weakly voltage-dependent block of frog Müller cell Kir channels by intracellular SP is not affected by changing the [K+]o: a difference from fast block (see Fig. 5). A: Representative recordings of K+ current evoked by the long protocol using 1 mM [SP]i and 120 mM [K+]i in the presence of 1 mM or 10 mM [K+]o. Depolarizing steps with 5 mV increments were applied from −100 mV to +140 mV. Currents are shown in the same current scale. B: i/V relationships of currents normalized to the maximal current (Imax) shown in A. Downward triangles, the i/V curve in 1 mM [K+]o. Circles, the i/V curve in 10 mM [K+]o. Solid lines are fits to the data with parameters: K50 (0) equals 5.7 mM and Ve equals −28.3 mV for 1 mM [K+]o, and K50 (0) equals 1.7 mM and Ve equals −33.5 mV for 10 mM [K+]o. The same i/V curves represented in the absolute current scale (Im, nA) are shown in the insert. Slow block is not dependent on [K+]o. C: Comparison of the currents recorded by applying the short (left) and long (right) protocols with 0.1 mM [SP]i in the presence of 100 mM [K+]o. Fast block is strongly dependent on [K+]o and this is further clarified in Figure 5. The amplitude calibration is the same for the left and right recordings with different time scale. D: i/V relationships measured at the end of recordings shown in C. Squares, measurements performed by applying the short protocol. Diamonds, measurements performed by applying the long protocol. Solid lines are fits to the data. The slow block is characterized by parameters K50 (0) = 0.48 mM and Ve = −37.8 mV.
Fig. 5.
Fig. 5.
Dependence of fast, strongly voltage-dependent block of frog Müller cell Kir channels on [K+]o. A: Representative recordings of K+ current evoked by the short protocol using 3 mM [SP]i in the presence of 5 mM or 10 mM [K+]o. Currents are shown in the same current scale. For illustrative purposes, currents recorded during some intermediate voltage steps within the membrane potential range at which the i/V relationship is linear were omitted from this panel. B: i/V relationships normalized to the maximal current (Imax) obtained with 3 mM [SP]i in the presence of different [K+]o. Arrows denote the maximal current amplitude obtained in each [K+]o. Downward triangles, the i/V curve in 1 mM [K+]o; upward triangles, the i/V curve in 3 mM [K+]o; squares, the i/V curve in 5 mM [K+]o; circles, the i/V curve in 10 mM [K+]o. Solid lines are fits to the data with K50 (0) and Ve values equal to 0.44 M and −13.8 mV, 34.7 M and −11.3 mV, 574.4 M and −9.6 mV, and 825.6 mM and −11.5 mV in 1 mM, 3 mM, 5 mM, and 10 mM [K+]o, respectively. The same i/V curves represented in the absolute current scale (Im, nA) are shown in the box. All data were obtained from the same experiment.
Fig. 6.
Fig. 6.
Effects of decreasing intracellular K+ concentration ([K+]i) on fast, strongly voltage-dependent and slow, weakly voltage-dependent block by [SP]i of frog Müller cell Kir channels. The i/V relationships measured by fast (squares) and slow (circles) protocols with 1 mM [SP]i and 12 mM [K+]i in 1 mM [K+]o. Solid lines are fits to the data. For the fast, strongly voltage-dependent block (squares) K50 (0) equals 0.018 M and Ve equals −12.38 mV. For the slow, weakly voltage-dependent block (circles) K50 (0) equals 0.32 mM and Ve equals −34.38 mV. Slow block is strongly dependent on [K+]i (compare with triangles in Fig. 4B where [K+]i is 120 mM).
Fig. 7.
Fig. 7.
Biphasic block in tsA201 cells expressing Kir4.1 channels. A: Recordings from a control tsA201 cell which does not express inward K+-currents (the currents below the dotted line are negligible). The pattern of the i/V curves remains unchanged during the time of cytoplasmic dialysis by the pipette with SP = 0. These outward currents represent SP-insensitive background (“leakage”) currents which were also insensitive to the Kir-channel blocker Ba2+ (0.1 mM, data not shown) and were considered background; they were subtracted in (C) to obtain pure Kir4.1-mediated current in Kir4.1-expressing cells. The cell had a membrane potential of −51 mV in [K+]o = 5 mM and was clamped at a holding potential of −50 mV using a patch pipette that did not contain spermine (SP), Ca2+ or Mg2+. A voltage ramp protocol was used (insert). B: Whole cell recording from a tsA201 cell transfected with cDNA encoding for Kir4.1 channels. In contrast to control cell in A, robust inward Kir-currents are expressed (below the dotted zero-current line) and outward currents have biphasic rectification shape (denoted by white and black arrowheads). This rectification is “straightening” (as in Müller cells, Fig. 1) when intracellular SP is washed out during cell dialysis in ~120 s using a patch pipette without spermine. The cell had a membrane potential of −78 mV in [K+]o = 5 mM and was clamped at a holding potential of −50 mV using a patch pipette that did not contain SP, Ca2+ or Mg2+. A voltage ramp protocol was used (see insert). C: Outside-out patch clamp recording from a tsA201 cell transfected with cDNA encoding for Kir4.1 channels; background, Ba2+-insensitive (0.1 mM Ba2+) current was subtracted. The trace represents an average of 10 responses to ramp stimuli shown in the insert. Pronounced biphasic rectification (denoted by white and black arrowheads) demonstrated two rectification processes that have been previously shown in Müller cells (Fig. 1B, left panel). D: Cell-attached patch-clamp recording from a tsA201 cell (3 mM K+ in the bath and pipette) transfected with modified cDNA encoding Kir4.1 channel that was used for high density Kir4.1 expression to reduce the contribution of the background current (see Methods). The graph shows the i/V relationship of Kir4.1 derived from the voltage ramp portion of the current through cell-attached patch (open circles, an average of 9 original traces in the insert, stimulation by voltage ramp as in (C) and its fit to the biphasic SP block model (solid line). The model (see in Methods) uses two sites in the channel with different sensitivity to SP and voltage. The white arrowhead points to the area of high affinity, weakly voltage-dependent SP block (“Slow” block), and the black arrowhead points to the low affinity, steeply voltage-dependent SP block (“Fast” block). The dashed line corresponds to the Goldman-Hodgkin-Katz type of i/V through the unblocked open channel used in the model. The biphasic block demonstrates similar Kir4.1 channel behavior as in (C), however under conditions of undisturbed intracellular environment in tsA201 cell. E: Whole cell recording from a tsA201 cell transfected with cDNA encoding Kir4.1 channels using voltage-steps. The membrane potential was −74 mV in [K+]o = 5 mM. The cell was clamped at a holding potential of −60 mV using patch pipette that did not contain SP, Ca2+ and Mg2+. The recording was obtained after 120 s of cytoplasmic dialysis. Voltage step protocol: an increment by 5 mV from −60 mV. F: Whole cell recording from a tsA201 cell transfected with cDNA encoding Kir4.1 channels using a patch pipette with 300 μM spermine. The recording was obtained after 120 s of dialysis with SP. The membrane potential was −77 mV and the holding potential was −60 mV. Voltage step protocol: an increment by 5 mV from −60 mV. Block of Kir4.1 outward currents by SP is similar to that seen in Müller cells (see Fig. 2) representing “fast” block.
Fig. 8.
Fig. 8.
Fast and slow blocks of Kir4.1 channel expressed in tsA201 cells by SP. A: Fast, strongly voltage-dependent block of K+ currents were induced in a tsA201 cell expressing Kir4.1 channels by a depolarizing pulse protocol (shown below the records with 5 mV steps) with 10 mM [SP]i in the presence of 1 mM or 3 mM [K+]o. Currents are shown in the same current scale. Current relaxations from the maximum amplitude to 10% of decay induced by the voltage jump to 85 mV and represented in the semi-logarithmic plot are shown below. Solid line, the decay in 1 mM [K+]o; dotted line, the decay in 3 mM [K+]o. Both decays can be well fitted by a single-exponential function with the decay time constants (τ) of 239.6 ms and 648.6 ms for 1 mM and 3 mM [K+]o, respectively. B: i/V relationships normalized to the maximal current (Imax) value measured at the end of depolarizing pulses from records shown in (A). Arrows denote the maximal amplitude (Imax) of current. Downward triangles, in the presence of 1 mM [K+]o; circles, in the presence of 3 mM [K+]o. Solid lines are fits to the data with the parameters: K50 (0) = 37.4 M and Ve = −5.4 mV, and K50 (0) = 411.6 M and Ve = −6.1 mV for 1 mM and 3 mM [K+]o, respectively. The same i/V curves replotted in an absolute current amplitude scale (Im (nA)) are shown in box. C: Slow, weakly voltage-dependent, block of K+ currents by SP in a tsA201 cell expressing Kir4.1 channels.K+ currents were induced in the tsA201 cell by the depolarizing protocol (shown below the records with 5 mV steps) with 10 mM [SP]i and in the presence of 5 mM [K+]o. D: The i/V relationship (circles) measured at the end of depolarizing pulses from the currents shown in (C). Solid line, fits to the data with K50 (0) equals to 7.0 mM and Ve equals to −24.0 mV demonstrate the similarity of slow block features between tsA201 cells expressing Kir4.1 and Müller cells (Fig. 4 and Table I).

Similar articles

Cited by

References

    1. Amedee T, Roberts A, Coles JA. 1997. Potassium homeostasis and glial energy metabolism. Glia 21:46–55. - PubMed
    1. Antonov SM, Skatchkov SN, Krusek J, Veh RW, Pannicke T, Nichols CG, Reichenbach A, Eaton MJ. 2003. Two distinct sites of spermine block in Kir4.1 channels. In 33rd Annual Meeting of the Society for Neuroscience, New Orleans, LA.
    1. Biedermann B, Skatchkov SN, Bringmann A, Pannicke T, Veh R, Bernstein H-G, Reichenbach A. 1998. Spermine/Spermidine is expressed by retinal glial (Müller) cells, and controls distinct K+ channels of their membrane. Glia 23:209–220. - PubMed
    1. Bowie D, Mayer ML. 1995. Inward rectification of both AMPA and kainate subtype glutamate receptors generated by polyamine-mediated ion channel block. Neuron 15:453–462. - PubMed
    1. Bringmann A, Pannicke T, Francke M, Wiedemann P, Skatchkov SN, Osborn NN, Reichenbach A. 2006. Müller cells in the healthy and diseased retina. Prog Retin Eye Res 25:397–424. - PubMed

Publication types