. 2008 Mar 28;377(3):636-46.
doi: 10.1016/j.jmb.2008.01.054. Epub 2008 Jan 30.

Identification and structural characterization of a CBP/p300-binding domain from the ETS family transcription factor GABP alpha

Affiliations

Identification and structural characterization of a CBP/p300-binding domain from the ETS family transcription factor GABP alpha

Hyun-Seo Kang et al. J Mol Biol. .

Abstract

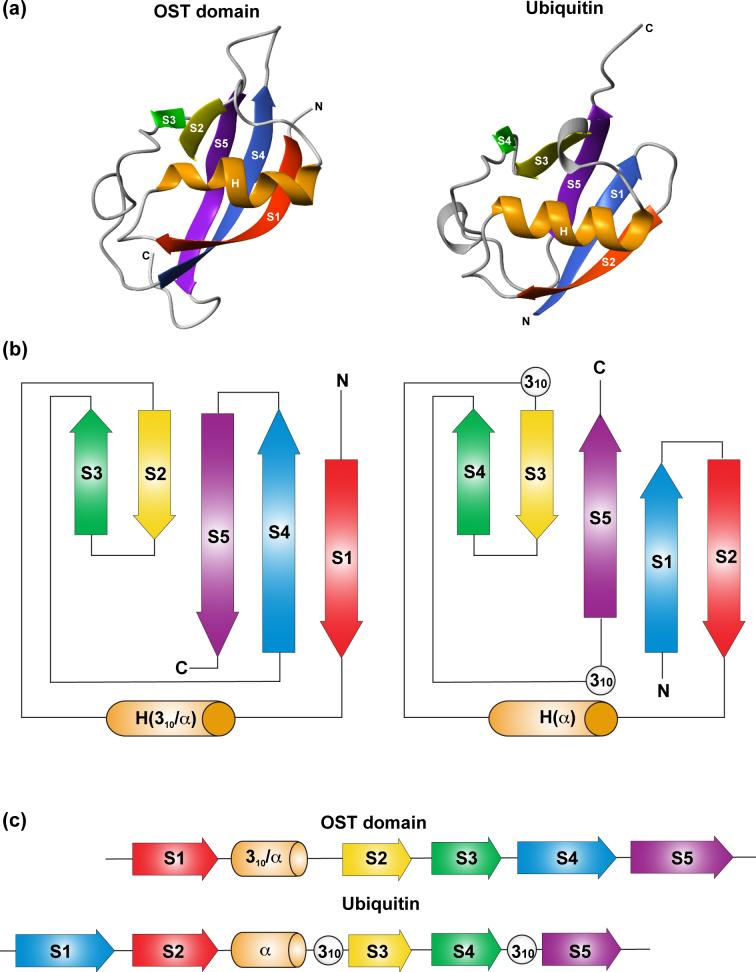
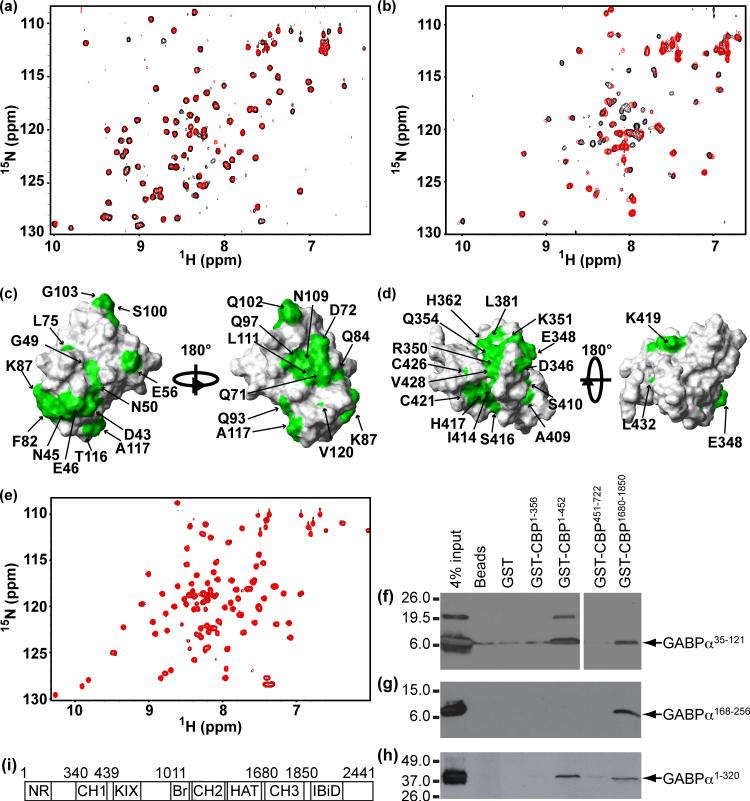
Using NMR spectroscopy, we identified and characterized a previously unrecognized structured domain near the N-terminus (residues 35-121) of the ETS family transcription factor GABP alpha. The monomeric domain folds as a five-stranded beta-sheet crossed by a distorted helix. Although globally resembling ubiquitin, the GABP alpha fragment differs in its secondary structure topology and thus appears to represent a new protein fold that we term the OST (On-SighT) domain. The surface of the GABP alpha OST domain contains two predominant clusters of negatively-charged residues suggestive of electrostatically driven interactions with positively-charged partner proteins. Following a best-candidate approach to identify such a partner, we demonstrated through NMR-monitored titrations and glutathione S-transferase pulldown assays that the OST domain binds to the CH1 and CH3 domains of the co-activator histone acetyltransferase CBP/p300. This provides a direct structural link between GABP and a central component of the transcriptional machinery.


Figures

Figure 1
Figure 1
(a) Cartoon of GABP domain organization. Boundaries are predicted or correspond to fragments used for studies of the individual domains. (b) The close superimposition of corresponding peaks in the 1H-15N HSQC spectra of 15N-labeled GABPα35−121 (black) and GABPα1−320 (red) demonstrates that the OST domain adopts an independently folded structure. The additional well-dispersed peaks in the spectrum of GABPα1−320 arise from the PNT domain, whereas those clustered near ∼8.0 to 8.6 ppm in 1H correspond to residues with predominantly random coil conformations. Assignments are given for GABPα35−121, and aliased peaks are denoted with an asterisk. (c) “Beads-on-a-string” model of full-length GABPαshowing the 3 structured domains (PNT, 1SXD.pdb; ETS, 1AWC.pdb) along with all remaining residues in extended conformations. Methods: Genes encoding GABPα35−121, GABPα1−169, and GABPα1−320 were PCR-amplified from the full-length murine GABPαDNA (Genbank 34328119) and inserted in the vector pET28a (Novagen) for expression with an N-terminal His6-tag and thrombin cleavage site. A codon for non-native Trp122 was added to the GABPα35−121 gene to facilitate concentration measurements by absorbance spectroscopy. His6-GABPα168−256 was previously described. The GABP constructs were expressed in E. coli BL21(λDE3) cells grown at 37 °C in LB or minimal M9T medium containing 1 g/l 15NH4Cl for uniform 15N-labeling, 1 g/l 15NH4Cl and 3 g/l 13C6-glucose for uniform 13C/15N-labeling, and 0.3 g/l 13C6-glucose and 2.7 g/l 12C6-glucose for non-random 10% 13C-labeling (Stable Spectral Isotopes). After induction with 1 mM IPTG at OD600 ∼ 1 and growth for 4 hours at 37 °C, the cells were harvested by centrifugation. The cell pellets were resuspended in buffer A (5 mM imidazole, 50 mM HEPES (pH 7.5), 500 mM NaCl, 5 % glycerol) and lysed by passage through a French press three times at 10,000 psi, followed by 15 min of sonication on ice. The lysate was cleared by centrifugation, and the supernatant loaded onto a Ni-NTA column (GE Healthcare), pre-equilibrated with buffer A. The column was washed with 10 column volumes of buffer A plus 60 mM imidazole, and then the bound proteins were eluted with buffer A plus 250 mM imidazole. Following SDS-PAGE analysis, the appropriate fractions were pooled and dialyzed overnight in 20 mM sodium phosphate (pH 7.2) and 20 mM NaCl with a few crystals of thrombin (Roche) for the cleavage of the N-terminal His6-tag. Thrombin and the cleaved His6-tag were removed by incubation with ρ-aminobenzamidine beads (Sigma) and TALON metal affinity resin (BD Biosciences) at room temperature with mild shaking for 15 min, followed by centrifugation. The purified proteins, with an N-terminal Gly-Ser-His remaining from the cleavage site, were concentrated to ∼ 1 to 1.5 mM in NMR sample buffer (20 mM sodium phosphate (pH 7.0), 50 mM NaCl, 2 mM DTT, ∼10 % D2O) using a 5 kDa cut-off Amicon Ultrafiltration device (Millipore). Spectra were recorded at 30 °C using Varian 500 MHz Unity, 600 MHz Inova, or 800 MHz Inova NMR spectrometers equipped with a triple resonance gradient probes, and analyzed using NMRpipe and Sparky. Main-chain and aliphatic side-chain 1H, 13C, and 15N resonances were assigned using standard triple resonance correlation experiments. Resonances from aromatic side-chains were assigned using 1H-13C HSQC, CβHδand CβHεexperiments. Stereospecific assignments of prochiral Hβ,β signals were obtained from HNHB and short mixing time (30 msec) 15N-TOCSY-HSQC spectra, of Asn and Gln 15NH2 groups from a EZ-HMQC-NH2 spectrum, and of Val and Leu methyl groups from a constant time 1H-13C HSQC spectrum of the non-randomly 10% 13C-labeled protein.
Figure 2
Figure 2
(a) Ribbon diagram of the lowest-energy NMR-derived structure of the GABPα OST domain (“front” view), with the β-sheet, helix, and two distinct loops (S3/S4 and S4/S5) shown in yellow, red, and cyan, respectively. Superimposed backbone (b) and hydrophobic sidechain (c) atoms from the structural ensemble of GABPα35−121, with selected residues labelled for reference. (d) Two clusters of negatively-charged Asp and Glu residues (red) are observed on the “front” (left) and “back” (right) of the OST domain. In contrast, no extended clusters of (d) positively-charged Arg, His, or Lys residues (blue) or (e) exposed hydrophobic residues (green) are found on its surface (polar residues in grey). Methods: The tertiary structure of OST was calculated with ARIA(v1.2)/CNS utilizing distance, dihedral angle, and orientation restraints (Table 1). Interproton distance restraints were obtained from 3D 15N- NOESY-HSQC (600 MHz, 150 msec mixing time), simultaneous aliphatic 13C- and amide 15N-NOESY-HSQC (800 MHz, 125 msec), aromatic 13C- NOESY-HSQC (500 MHz, 125 msec), and constant time methyl-methyl and amide-methyl-NOESY spectra (600 MHz, 140 msec), followed by the automatic and iterative NOE assignments in ARIA. Mainchain dihedral angles were derived from 1H, 13C, and 15N chemical shifts using TALOS. The predicted dihedral angles were only used when the Φ values agreed with 3JNH-Hα coupling constants obtained from a HNHA spectrum. The χ1 angle restraints for residues with prochiral Hβ protons were determined in concert with the stereospecific assignments, and those of the Val, Thr, and Ile residues were determined from 3JNCα and 3JC’Cα coupling constants measured using N-Cα and C'-Cαspin echo experiments. For residues not showing 3J couplings indicative of rotamer averaging, the χ1 angles were set to ± 60° or 180° based on a staggered rotamer model. 1HN-15N RDC orientational restraints were measured from 1H-15N IPAP-HSQC spectra using protein aligned with stretched gels, and incorporated at iteration 4 with the SANI routine in ARIA, with default energy constants of 0.2 and 1 kcal mol−1 Hz−2 for the first and second simulated annealing cooling stages, respectively. Values of the alignment tensor (R = 0.3, Da = 5.3 Hz) were estimated by the histogram method, followed by a grid search for minimal SANI violations. All His imidazole sidechains were determined to be in the neutral Nε2 tautomeric state from long-range 1H-15N correlation measurements. All Xaa-Pro amides were constrained to the trans conformation based on a chemical shift analysis with POP. In the final set of 10 water-refined structures, there were no violations greater than 0.5 Å and 5° for distance and angle restraints, respectively. The structural ensemble was analyzed using Procheck-NMR and secondary structures determined according to Promotif and Vadar. Structural figures were generated using MOLMOL and PyMOL.
Figure 3
Figure 3
Structure comparisons of the GABPα OST domain and ubiquitin (1UBQ.pdb). (a) The global folds of the two proteins are clearly similar. (b) However, secondary structure topology diagrams show that the direction of β-strand S5 in the OST domain is opposite from that of the corresponding strand in ubiquitin. (c) The sequential orders of secondary structural elements are also different. In addition, ubiquitin has a regular α-helix and 2 short 310-helices, whereas the OST domain has a distorted α-helix preceded by a 310-helix.
Figure 4
Figure 4
The GABPα OST domain binds to the mCBP CH1 and CH3 domains. (a,c) Superimposed 1H-15N HSQC spectra of 15N-labeled OST domain before (black, 0.1 mM) and after (red, 0.09 mM) addition of unlabeled CH1 (0.09 mM final). The top quartile of residues with backbone or sidechain amides showing intensity decreases due to CH1 domain binding are mapped in green on to the surface of the OST domain. (b,d) Superimposed 1H-15N HSQC spectra of 15N-labeled CH1 before (black, 0.1 mM) and after (red, 0.05 mM) addition of unlabeled OST domain (0.05 mM final). The top quartile of residues showing intensity decrease due to OST domain binding are mapped in green on to the surface of the CH1 domain (1U2N.pdb). (e) Superimposed 1H-15N HSQC spectra of 15N-labeled PNT domain before (black, 0.1 mM) and after (red, 0.1 mM) addition of unlabeled CH1 (0.1 mM final). The absence of any spectral changes indicates that no measurable binding occurs between the PNT and CH1 domains. These conclusions are supported by pulldown assays, involving 200−300 pmol of the indicated GST-tagged mCBP fragments, pre-bound to glutahionine-sepharose beads (20 μL), and 5 μM of FLAG-HMK-tagged (f) GABPα35−121 (OST domain), (g) GABPα168−256 (PNT domain), and (h) GABPα1−320 (OST and PNT domains). Following bead collection and washing, binding was analyzed by Western blotting using an anti-FLAG antibody. Approximate molecular weight marker positions on the 4−15% SDS-PAGE gels are shown. The slower migrating band in the GABPα35−121 sample is attributed to disulfide-linked dimers. (i) Cartoon of the domain structure of CBP. NMR Methods: The gene encoding the His6-tagged CH1 domain (mCBP340−439) was PCR cloned from the full length CBP gene (Genbank 70995311) into the pET28b (Novagen) vector for expression in E. coli BL21(λDE3) cells. Cells were grown at 30 °C in ZnSO4 supplemented (150 μM) LB or 15N-minimal M9T medium to OD600 ∼ 1, followed by induction with 1 mM IPTG and growth for overnight at 16 °C. Purification was as in Figure 1, except that buffer A was modified to 150 μM ZnSO4 , 5 mM imidazole, 50 mM Tris (pH 7.5), 500 mM NaCl, and 5 % glycerol. The purified CHI (mCBP340−439), OST (GABPα35−121), and PNT (GABPα168−256) domains were dialyzed into NMR buffer (20 mM Tris (pH 6.9), 50 mM NaCl, 2 mM DTT, ∼10 % D2O) and concentrated by ultrafiltration. 1H-15N HSQC spectra were recorded at 25 °C. GST-pulldown Methods: A DNA cassette encoding the FLAG tag and heart muscle kinase (HMK) target sequences was inserted into pET28a NdeI site of the GABPα constructs to generate clones for His6-FLAG-HMK-GABPα35−121, His6-FLAG-HMK-GABPα168−256, and His6-FLAG-HMK-GABPα1−320. Tagged fragments were purified as described for GABPα35−121 in Figure 1. GST pulldown assays were conducted in 20 mM Tris pH 7.9, 10% glycerol, 180 mM KCl, 0.2 mM EDTA, 10 μM ZnSO4, 0.5% NP40, 0.5 mM PMSF, 2−10 mM DTT, 0.1 mg/mL BSA, with Glutathione-Sepharose 4B beads (GE Healthcare). After incubation for 16 hr at 4 °C with constant rotation, the beads were collected by centrifugation and washed with binding buffer. The bound proteins were eluted using 3x SDS sample buffer, separated by SDS-PAGE, transferred to PVDF membranes, blotted with a 1:20,000 dilution of FLAG M2 antibody (Sigma), and visualized by ECL Plus (GE Healthcare). Panels (f), (g), and (h) are representative immoblots from experiments repeated four times. An SDS-PAGE gel of the protein samples used in these assays is provided in Supplemental Figure S4.

References

    1. Rosmarin AG, Resendes KK, Yang ZF, McMillan JN, Fleming SL. GA-binding protein transcription factor: A review of GABP as an integrator of intracellular signaling and protein-protein interactions. Blood Cells Mol. Diseases. 2004;32:143–154. - PubMed
    1. Hsu T, Schulz RA. Sequence and functional properties of ets genes in the model organism Drosophila. Oncogene. 2000;19:6409–6416. - PubMed
    1. Ristevski S, O'Leary DA, Thornell AP, Owen MJ, Kola I, Hertzog PJ. The Ets transcription factor GABP alpha is essential for early embryogenesis. Mol. Cell. Biol. 2004;24:5844–5849. - PMC - PubMed
    1. Xue HH, Bollenbacher-Reilley J, Wu Z, Spolski R, Jing X, Zhang YC, McCoy JP, Leonard WJ. The transcription factor GABP is a critical regulator of β lymphocyte development. Immun. 2007;26:421–431. - PubMed
    1. O'Leary DA, Noakes PG, Lavidis NA, Kola I, Hertzog PJ, Ristevski S. Targeting of the Ets factor GABP alpha disrupts neuromuscular junction synaptic function. Mol. Cell. Biol. 2007;27:3470–3480. - PMC - PubMed

Publication types

MeSH terms

Substances

Associated data

LinkOut - more resources