. 2008 May;20(5):969-77.
doi: 10.1016/j.cellsig.2008.01.016. Epub 2008 Feb 1.

PKCdelta regulates the stimulation of vascular endothelial factor mRNA translation by angiotensin II through hnRNP K

Affiliations

PKCdelta regulates the stimulation of vascular endothelial factor mRNA translation by angiotensin II through hnRNP K

Kavithalakshmi Sataranatarajan et al. Cell Signal. 2008 May.

Abstract

Angiotensin II (Ang II)-induced renal injury is partly mediated by growth factors such as VEGF. We have previously shown that Ang II rapidly increases VEGF protein synthesis in proximal tubular epithelial (MCT) cells by augmenting mRNA translation, which is partly dependent on activation and binding of hnRNP K to 3' untranslated region (UTR) of VEGF mRNA. Regulation of hnRNP K activation by PKCdelta was studied in MCT cells. Transfection with a PKCdelta siRNA inhibited hnRNP K Ser302 phosphorylation and activation, and reduced Ang II stimulation of VEGF synthesis. Inhibition of PKCdelta with röttlerin also prevented binding of hnRNP K to VEGF mRNA and reduced the efficiency of VEGF mRNA translation. In db/db mice at 2 weeks of type 2 diabetes, VEGF expression was increased, which was due not to increase in transcription but to augmented translation of VEGF mRNA. Augmented VEGF expression was associated with increased binding of hnRNP K to VEGF mRNA. c-src and PKCdelta activities and hnRNP K phosphorylation on Ser302 in renal cortex of db/db mice were increased compared to control mice. We conclude: Ang II-induced VEGF mRNA translation is associated with activation of hnRNP K in MCT cells. In the signaling pathway leading to hnRNP K activation induced by Ang II, PKCdelta is downstream of c-src. PKCdelta-mediated phosphorylation of hnRNP K is required for Ang II stimulation of VEGF mRNA translation. In mice with type 2 diabetes, src and PKCdelta activation and hnRNP K phosphorylation correlate with increased VEGF mRNA translation and kidney hypertrophy. 3' UTR events are important in regulation of VEGF expression in models of renal injury.


Figures
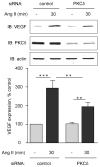
Figure 1
Figure 1. Effect of PKCδ siRNA on Ang II stimulation of VEGF synthesis
Immunoblots for VEGF, PKCδ and actin were carried out on lysates from MCT cells transfected with siRNA (control or specific for PKCδ, 100 nM each) for 48 h, and incubated with or without Ang II (1 nM) for 30 min. PKCδ immunoreactivity was measured to assess efficiency of RNA interference. The lower panel represents quantitation of 3 independent experiments, expressed as percent (mean ± se) of cells transfected with control siRNA and untreated. ** p < 0.01, *** p < 0.001 by ANOVA.
Figure 2
Figure 2. c-src is required for PKCδ activation and association with hnRNP K
A. c-src and PKCδ associate with hnRNP K. PKCδ and c-src immunoreactivity was measured in hnRNP K immunoprecipitates from MCT cells treated with Ang II for the indicated times. Note the presence of the immunoglobulin heavy chain (IgG-H) in the c-src immunoblot. The figure presents blots representative of 3 independent experiments. The lower panel represents quantitation of 3 independent experiments, expressed as percent (mean ± se) of total VEGF mRNA (in all 4 fractions). * p < 0.05, ** p < 0.01, *** p < 0.001 by ANOVA. B. c-src inhibition prevents PKCδ association with hnRNP K. PKCδ immunopreactivity was measured in hnRNP K immunoprecipitates from MCT cells preincubated with PP2 for 30 min before treatment with Ang II (1 nM) for 5 and 15 min. The figure presents blots representative of 3 independent experiments. The lower panel represents quantitation of 3 independent experiments, expressed as percent (mean ± se) of total VEGF mRNA (in all 4 fractions). * p < 0.05, ** p < 0.01 by ANOVA. C. hnRNP K and PKCδ colocalize in the nucleus of MCT cells treated with Ang II. MCT cells were seeded in 4-well chamber slides. Quiescent cells were treated with 1 nM Ang II for 15 min in the absence or presence of PP2. PKCδ was detected with FLUOR-conjugated antibody (green) and hnRNPK with Cy3-conjugated antibody (red). Orange and yellow colors represent weak and strong co-localization, respectively. Phase contrast was used to visualize the cells. Shown are pictures representative from two independent experiments. D. c-src inhibition prevents PKCδ tyrosine phosphorylation. Immunoblots for phospho-Tyr311-PKCδ, PKCδ and actin were carried out on lysates from MCT cells transfected with siRNA (control or specific for c-src) for 24 h, and incubated with or without Ang II (1 nM) for 15 min. C-src immunoreactivity was measured to assess efficiency of RNA interference. The lower panel represents quantitation of 3 independent experiments, expressed as percent (mean ± se) of cells transfected with control siRNA and untreated. ** p < 0.01, ns - not significant by ANOVA.
Figure 3
Figure 3. PKCδ is required for hnRNP K activation and binding to VEGF mRNA and regulates VEGF mRNA translation
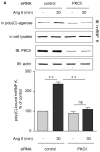
A. PKCδ and hnRNP K activation. Poly(C)-agarose pull-down assay was carried out on lysates from MCT cells transfected with siRNA (control or specific for PKCδ) for 24 h, and incubated with or without Ang II (1 nM) for 30 min. PKCδ and hnRNP K immunoreactivity was measured in cell lysates to assess efficiency of RNA interference and total amount of hnRNP K, respectively. The lower panel represents quantitation of 3 independent experiments, expressed as percent (mean ± se) of cells transfected with control siRNA and untreated. ** p < 0.01, ns - not significant by ANOVA. B. hnRNP K binding to VEGF mRNA. Presence of VEGF mRNA in hnRNP K immunoprecipitates from MCT cells pre-treated with röttlerin (10 μM, 30 min) before treatment with Ang II (1 nM) for 30 min was assessed by RT-PCR. The lower panel represents quantitation of 3 independent experiments, expressed as percent (mean ± se) of untreated cells. ** p < 0.01 by ANOVA. C. PKCδ and VEGF mRNA translation. Polysome assay was performed on lysates from MCT cells treated with Ang II with or without pre-incubation with röttlerin. The lower panel represents quantitation of 3 independent experiments, expressed as percent (mean ± se) of total VEGF mRNA (in all 4 fractions). ** p < 0.01 by ANOVA.
Figure 4
Figure 4. VEGF synthesis in diabetic kidneys
A. VEGF expression. VEGF protein expression was measured by immunoblot on kidney cortex homogenates, and VEGF mRNA expression was measured by RT-PCR on RNA extracted from kidney cortex from control (db/m) and diabetic (db/db) mice. The lower panel represents quantitation of data obtained on kidney cortices from 5 individual mice, expressed as percent (mean ± se) of db/m mice. ** p < 0.01 by t-test. B. VEGF mRNA translation. Polysome assay was performed on homogenates of kidney cortex from control (db/m) and diabetic (db/db) mice. The lower panel represents quantitation of 3 independent experiments, expressed as percent (mean ± se) of total VEGF mRNA (in all 4 fractions). ** p < 0.01 by ANOVA. C. hnRNP K binding to VEGF mRNA. Presence of VEGF mRNA in hnRNP K immunoprecipitates from kidney cortex from control (db/m) and diabetic (db/db) mice was assessed by RT-PCR. The lower panel represents quantitation of data obtained on 5 individual mice, expressed as percent (mean ± se) of db/m mice. * p < 0.05 by t-test.
Figure 5
Figure 5. signaling pathway leading to hnRNP K activation in diabetic kidneys
The lower panels represent quantitation of data obtained on 5 individual mice for each group, expressed as percent (mean ± se) of db/m mice. * p < 0.05, ** p < 0.01 by t-test. A. PKCδ activity was measured by an in vitro kinase assay, using MBP as a substrate in kidney cortex homogenates. Total PKCδ in the corresponding lysates was measured by immunoblot. Incorporation of [32P]-ATP into MBP was measured by autoradiography and quantitated by densitometry. B. c-src activity was measured by an in vitro kinase assay in the same kidney cortex homogenates used in Fig. 5A. Total c-src in the corresponding lysates was measured by immunoblot. c-src autophosphorylation was measured by autoradiography and quantitated by densitometry. C. Phosphorylation of PKCδ on Tyr311 was assessed by immunoprecipitation of PKCδ followed by immunoblot using an antibody specific for phospho-Tyr311. D. Association of PKCδ with hnRNP K was assessed by immunoprecipitation of PKCδ from kidney cortex homogenates followed by immunoblot for hnRNP K. E. Phosphorylation of hnRNP K on Ser302 was assessed by immunoprecipitation of hnRNP K from kidney cortex homogenates followed by immunoblot with an antibody specific for phospho-Ser302.
Figure 6
Figure 6. sequential phosphorylation by c-src and PKCδ leads to hnRNP K activation
basal state: minimal association of hnRNP K with c-src and PKCδ. 5 min treatment with Ang II: c-src binds hnRNP K and phosphorylates it; 15–30 min of stimulation: PKCδ binds to hnRNP K and is phosphorylated by c-src on Tyr311; activated PKCδ phosphorylates hnRNP K on Ser302, which promotes binding of hnRNP K to VEGF mRNA and stimulates its translation.

Similar articles

Cited by

References

    1. Rincon-Choles H, Kasinath BS, Gorin Y, Abboud HE. Kidney Int Suppl. 2002:8–11. - PubMed
    1. Feliers D, Duraisamy S, Barnes JL, Ghosh-Choudhury G, Kasinath BS. Am J Physiol Renal Physiol. 2005;288:F521–529. - PubMed
    1. Feliers D, Lee MJ, Ghosh-Choudhury G, Bomsztyk K, Kasinath BS. Am J Physiol Renal Physiol. 2007;293:F607–615. - PubMed
    1. Ostareck-Lederer A, Ostareck DH, Cans C, Neubauer G, Bomsztyk K, Superti-Furga G, Hentze MW. Mol Cell Biol. 2002;22:4535–4543. - PMC - PubMed
    1. Ostrowski J, Schullery DS, Denisenko ON, Higaki Y, Watts J, Aebersold R, Stempka L, Gschwendt M, Bomsztyk K. J Biol Chem. 2000;275:3619–3628. - PubMed

MeSH terms