

Mitochondrial DNA damage and impaired base excision repair during epileptogenesis
- PMID: 18295498
- PMCID: PMC2696045
- DOI: 10.1016/j.nbd.2007.12.009
Mitochondrial DNA damage and impaired base excision repair during epileptogenesis
Abstract
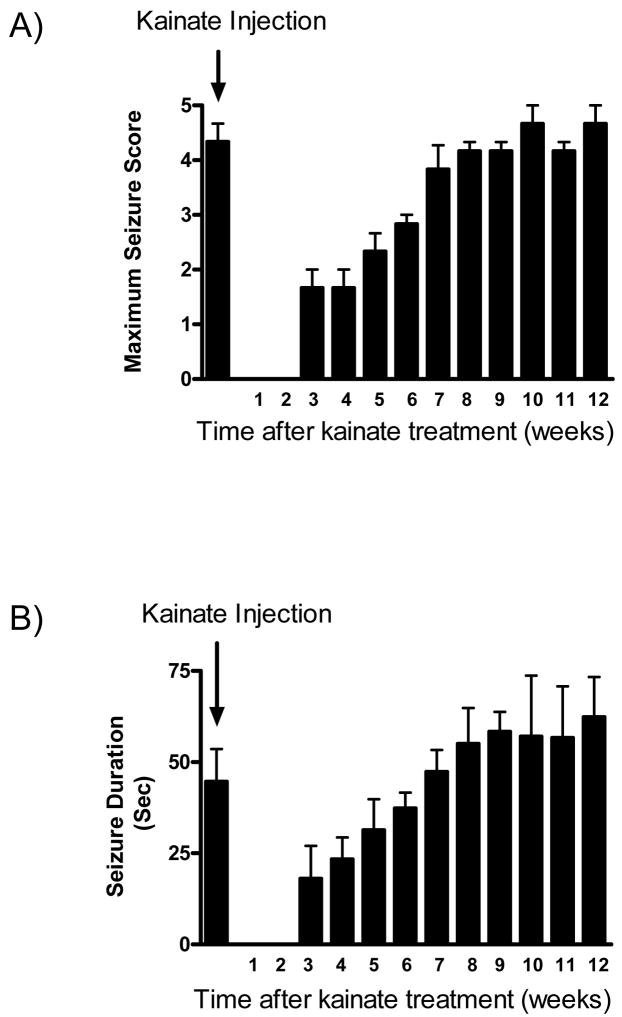
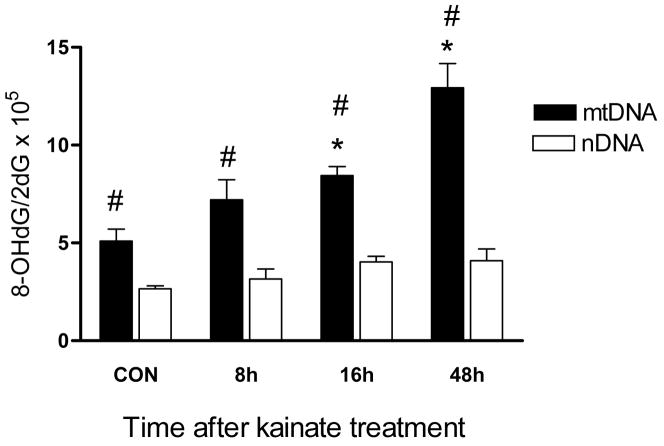
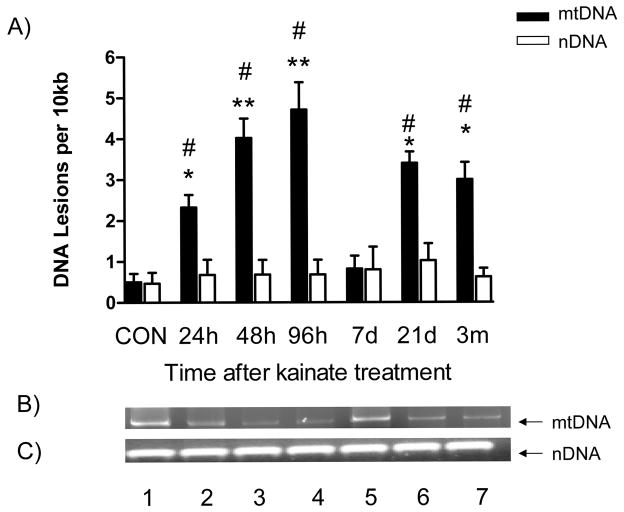
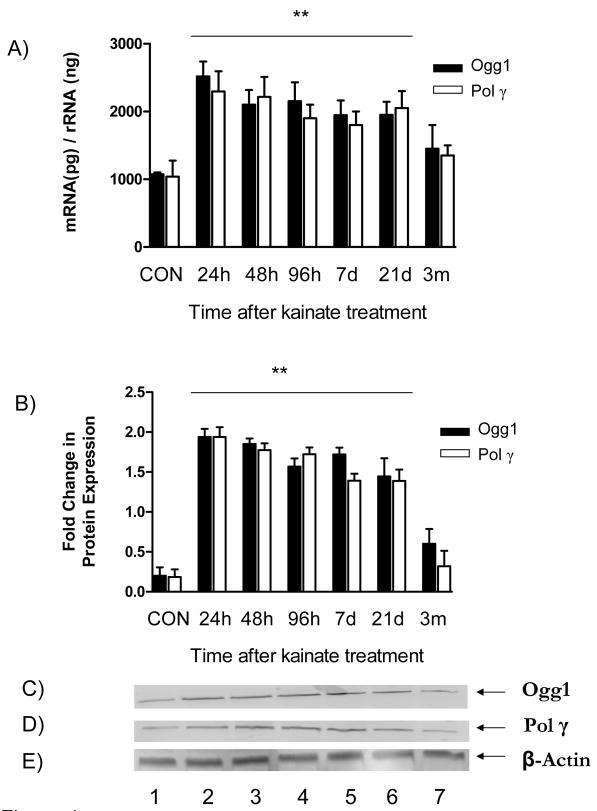
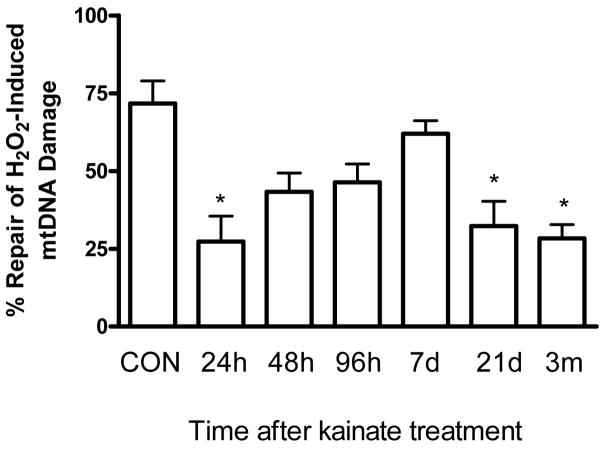
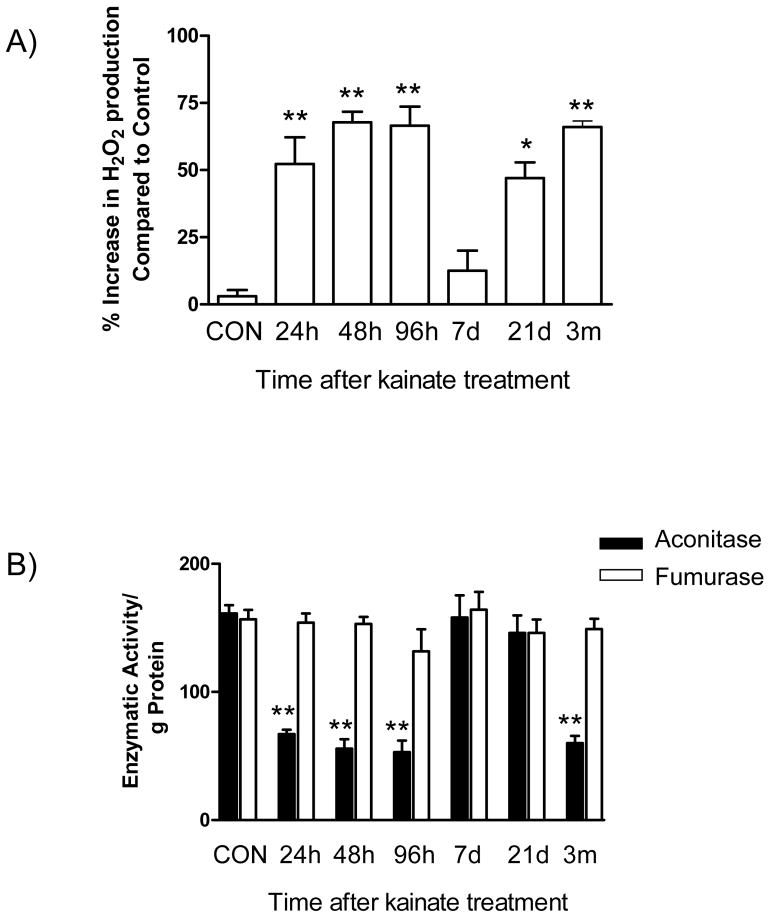
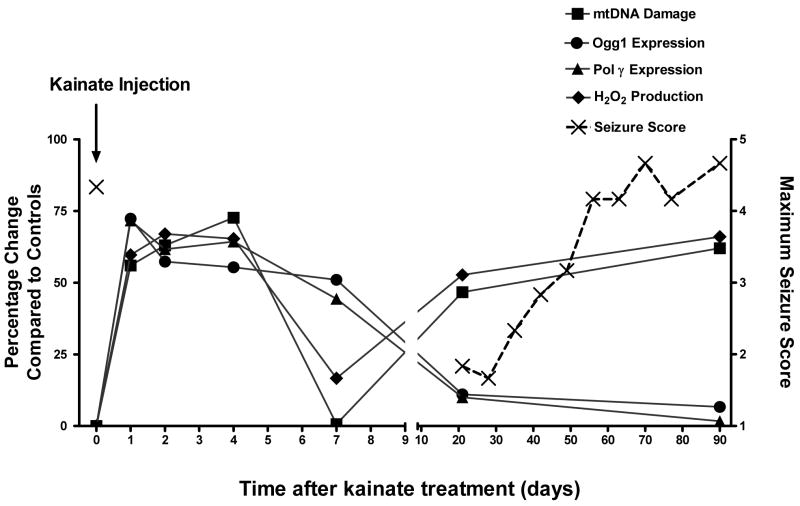
Oxidative stress and mitochondrial dysfunction are acute consequences of status epilepticus (SE). However, the role of mitochondrial oxidative stress and genomic instability during epileptogenesis remains unknown. Using the kainate animal model of temporal lobe epilepsy, we investigated oxidative mitochondrial DNA (mtDNA) damage and changes in the mitochondrial base excision repair pathway (mtBER) in the rat hippocampus for a period of 3 months after SE. Acute seizure activity caused a time-dependent increase in mitochondrial, but not nuclear 8-hydroxy-2-deoxyguanosine (8-OHdG/2dG) levels and a greater frequency of mtDNA lesions. This was accompanied by increased mitochondrial H2O2 production and a transient decrease in mtDNA repair capacity. The mtBER proteins 8-oxoguanine glycosylase (Ogg1) and DNA polymerase gamma (Pol gamma) demonstrated elevated expression at mRNA and protein levels shortly after SE and this was followed by a gradual improvement in mtDNA repair capacity. Recurrent seizures associated with the chronic phase of epilepsy coincided with the accumulation of mtDNA damage, increased mitochondrial H2O2 levels, decreased expression of Ogg1 and Pol gamma and impaired mtDNA repair capacity. Together, increased oxidative mtDNA damage, mitochondrial H2O2 production and alterations in the mtBER pathway provide evidence for mitochondrial oxidative stress in epilepsy and suggest that mitochondrial injury may contribute to epileptogenesis.
Figures
Similar articles
-
Mitochondria, oxidative stress, and temporal lobe epilepsy.Epilepsy Res. 2010 Jan;88(1):23-45. doi: 10.1016/j.eplepsyres.2009.09.020. Epub 2009 Oct 21. Epilepsy Res. 2010. PMID: 19850449 Free PMC article. Review.
-
Oxidative DNA damage and its repair in rat spleen following subchronic exposure to aniline.Toxicol Appl Pharmacol. 2008 Dec 1;233(2):247-53. doi: 10.1016/j.taap.2008.08.010. Epub 2008 Aug 22. Toxicol Appl Pharmacol. 2008. PMID: 18793663 Free PMC article.
-
Increased 8-hydroxy-2'-deoxyguanosine in plasma and decreased mRNA expression of human 8-oxoguanine DNA glycosylase 1, anti-oxidant enzymes, mitochondrial biogenesis-related proteins and glycolytic enzymes in leucocytes in patients with systemic lupus erythematosus.Clin Exp Immunol. 2014 Apr;176(1):66-77. doi: 10.1111/cei.12256. Clin Exp Immunol. 2014. PMID: 24345202 Free PMC article.
-
Mitochondrial 8-oxoguanine glycosylase decreases mitochondrial fragmentation and improves mitochondrial function in H9C2 cells under oxidative stress conditions.Am J Physiol Cell Physiol. 2014 Feb 1;306(3):C221-9. doi: 10.1152/ajpcell.00140.2013. Epub 2013 Dec 4. Am J Physiol Cell Physiol. 2014. PMID: 24304833 Free PMC article.
-
Mitochondrial base excision repair assays.Methods. 2010 Aug;51(4):416-25. doi: 10.1016/j.ymeth.2010.02.020. Epub 2010 Feb 25. Methods. 2010. PMID: 20188838 Free PMC article. Review.
Cited by
-
Mitochondrial respiration deficits driven by reactive oxygen species in experimental temporal lobe epilepsy.Neurobiol Dis. 2015 Mar;75:151-8. doi: 10.1016/j.nbd.2014.12.025. Epub 2015 Jan 17. Neurobiol Dis. 2015. PMID: 25600213 Free PMC article.
-
The inhibition of PGAM5 suppresses seizures in a kainate-induced epilepsy model via mitophagy reduction.Front Mol Neurosci. 2022 Dec 22;15:1047801. doi: 10.3389/fnmol.2022.1047801. eCollection 2022. Front Mol Neurosci. 2022. PMID: 36618822 Free PMC article.
-
Targeting deficiencies in mitochondrial respiratory complex I and functional uncoupling exerts anti-seizure effects in a genetic model of temporal lobe epilepsy and in a model of acute temporal lobe seizures.Exp Neurol. 2014 Jan;251:84-90. doi: 10.1016/j.expneurol.2013.11.005. Epub 2013 Nov 21. Exp Neurol. 2014. PMID: 24270080 Free PMC article.
-
Scavenging reactive oxygen species inhibits status epilepticus-induced neuroinflammation.Exp Neurol. 2017 Dec;298(Pt A):13-22. doi: 10.1016/j.expneurol.2017.08.009. Epub 2017 Aug 16. Exp Neurol. 2017. PMID: 28822838 Free PMC article.
-
Mitochondria, oxidative stress, and temporal lobe epilepsy.Epilepsy Res. 2010 Jan;88(1):23-45. doi: 10.1016/j.eplepsyres.2009.09.020. Epub 2009 Oct 21. Epilepsy Res. 2010. PMID: 19850449 Free PMC article. Review.
References
-
- Audebert M, Charbonnier JB, Boiteux S, Radicella JP. Mitochondrial targeting of human 8-oxoguanine DNA glycosylase hOGG1 is impaired by a somatic mutation found in kidney cancer. DNA Repair (Amst) 2002;1:497–505. - PubMed
-
- Ayala-Torres S, Chen Y, Svoboda T, Rosenblatt J, Van Houten B. Analysis of gene-specific DNA damage and repair using quantitative polymerase chain reaction. Methods. 2000;22:135–147. - PubMed
-
- Ballinger SW, Patterson C, Yan CN, Doan R, Burow DL, Young CG, Yakes FM, Van Houten B, Ballinger CA, Freeman BA, Runge MS. Hydrogen peroxide- and peroxynitrite-induced mitochondrial DNA damage and dysfunction in vascular endothelial and smooth muscle cells. Circ Res. 2000;86:960–966. - PubMed
-
- Ballinger SW, Van Houten B, Jin GF, Conklin CA, Godley BF. Hydrogen peroxide causes significant mitochondrial DNA damage in human RPE cells. Exp Eye Res. 1999;68:765–772. - PubMed
-
- Beal MF. Mitochondria take center stage in aging and neurodegeneration. Ann Neurol. 2005;58:495–505. - PubMed
Publication types
MeSH terms
Substances
Grants and funding
LinkOut - more resources
Full Text Sources
Other Literature Sources
Research Materials
