. 2008 Nov;18(11):2540-52.
doi: 10.1093/cercor/bhn015. Epub 2008 Feb 21.

Effects of familiarity on neural activity in monkey inferior temporal lobe

Affiliations

Effects of familiarity on neural activity in monkey inferior temporal lobe

Britt Anderson et al. Cereb Cortex. 2008 Nov.

Abstract

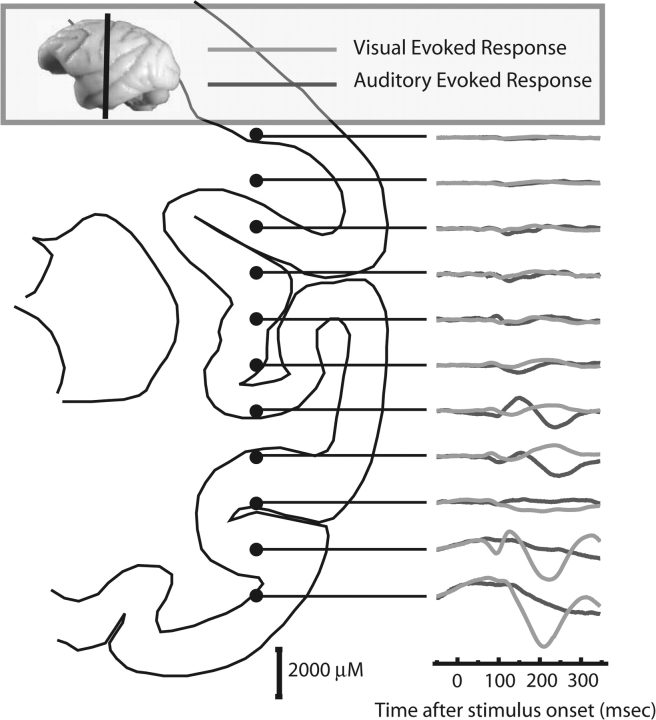
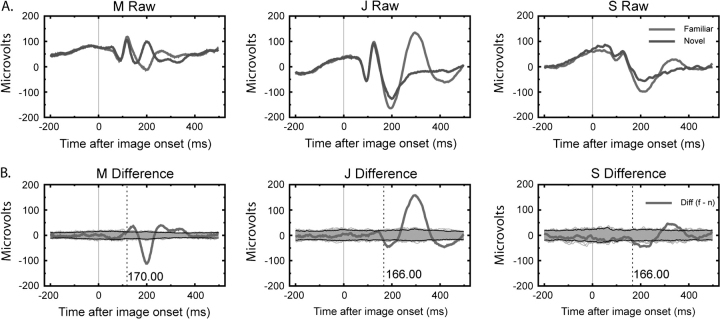
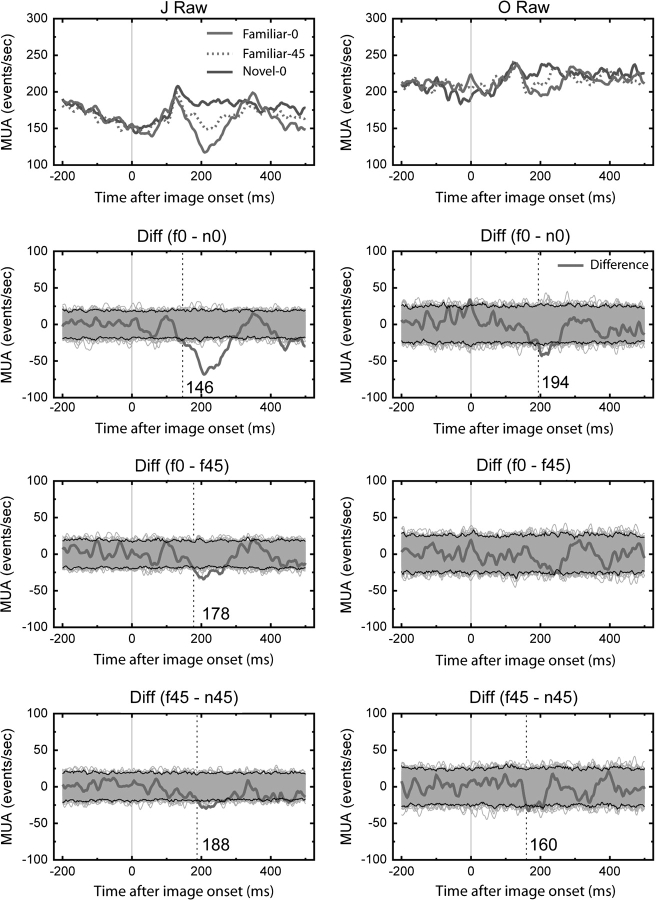
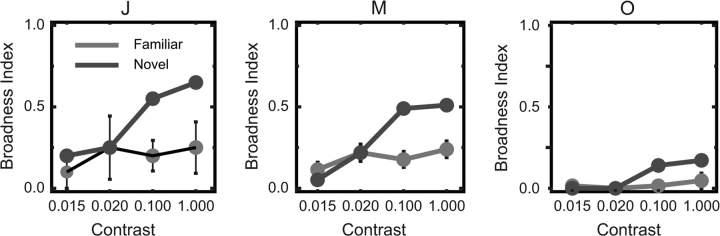
Long-term familiarity facilitates recognition of visual stimuli. To better understand the neural basis for this effect, we measured the local field potential (LFP) and multiunit spiking activity (MUA) from the inferior temporal (IT) lobe of behaving monkeys in response to novel and familiar images. In general, familiar images evoked larger amplitude LFPs whereas MUA responses were greater for novel images. Familiarity effects were attenuated by image rotations in the picture plane of 45 degrees. Decreasing image contrast led to more pronounced decreases in LFP response magnitude for novel, compared with familiar images, and resulted in more selective MUA response profiles for familiar images. The shape of individual LFP traces could be used for stimulus classification, and classification performance was better for the familiar image category. Recording the visual and auditory evoked LFP at multiple depths showed significant alterations in LFP morphology with distance changes of 2 mm. In summary, IT cortex shows local processing differences for familiar and novel images at a time scale and in a manner consistent with the observed behavioral advantage for classifying familiar images and rapidly detecting novel stimuli.


Figures

Figure 1.
Figure 1.
Effect of recording depth on the LFP. We recorded the evoked potential to auditory and visual stimuli at 2 mm intervals on a dorsal to ventral pass. The vertical line on the small inset image of a macaque brain shows the approximate A-P location of our recording based on the stereotaxic coordinates of the recording chamber. The line drawing of the hemisphere in the coronal plane is adapted from Paxinos et al. (2000) and shows, based on guide tube length and chamber dimensions, the approximate location of each of the recording sites and their associated auditory (green) and visual (red) evoked responses. Separated by only 2 mm the shape of the recorded wave form changes significantly and is sensory modality specific, consistent with the LFP being truly “local.”
Figure 2.
Figure 2.
Screening stimuli. (A) These are 2 examples of randomly generated “blobs” of the type used to screen for visual activity. Each blob was composed from a library of 64 strokes saved as alpha masks. Four randomly chosen strokes were randomly positioned and then colored with a randomly chosen texture. This gave us a method for screening for visual activity with images that were dissimilar from the photographic clip art images used for the familiar and novel test sets. (B) These are 2 of the familiar clip art images used for 1 of the monkeys. (C) Two novel images for 1 monkey on one day are shown. These came from the same photo clip art set as the familiar images.
Figure 3.
Figure 3.
Average LFP evoked by familiar and novel stimuli. (A) For each of 3 monkeys we show the visually evoked LFP to familiar and novel images averaged over all sessions for that monkey. Although the magnitude of the response varies, the general morphology is the same and there is a consistent increase in the magnitude of the LFP to familiar stimuli after 150 ms. (B) Permutation tests are used to confirm the statistical significance of the differences. For each monkey we recalculated the familiar–novel difference after scrambling the labels “familiar” and “novel”. The gray zone shows the range of the result over 1000 permutations and areas where the empirical difference (bold red line) exceeds the permutation sample are highlighted (dashed vertical lines). Black lines denote the 99% confidence interval bounds.
Figure 4.
Figure 4.
Average MUA evoked by familiar and novel stimuli. (A) For each of 3 monkeys we show the average visually evoked MUA to familiar and novel images. There are consistent responses for all 3 monkeys. There is a consistent increase in the magnitude of the MUA to novel stimuli after 150 ms. (B) Permutation tests are used to confirm the statistical significance of the differences. For each monkey we recalculated the familiar–novel difference after scrambling the labels “familiar” and “novel”.
Figure 5.
Figure 5.
LFP and MUA to familiar targets, familiar distractors, and novel images. For 1 monkey we had familiar images that were associated with a motor response and familiar images used as distractors that were never associated with a button press. The left column shows LFP responses and the right column MUA responses. The raw average responses for each image category show that both sets of familiar images are similar to each other and dissimilar to the novel images. This is confirmed in the permutation analyses where large and significant differences are seen for both categories of familiar images and the novel images (rows 2 and 4), but not from each other (row 3). There is a smaller significant effect when comparing familiar targets and distractors for the LFP signal, but not for the MUA measure. Note that the directions for the significant effects are in the opposite direction for the LFP and MUA measures.
Figure 6.
Figure 6.
LFP to familiar targets, novel images, in upright and rotated versions. LFP responses are in the left column for Monkey J and on the right for Monkey O. Familiar images shown upright or rotated 45° in the picture plane are different from the novel class. This is confirmed in the permutation analyses where we plot the empirically observed differences (bold red line) and 1000 permuted versions (range shown in gray). The second and third rows look generally similar and they compare the upright familiar to upright novel trials and the upright familiar to 45° rotated familiar trials. However, rotating 45° does not make a familiar image completely novel as there are still differences observed between these trials and novel image trials, especially for the LFP. The raw trace for the novel images rotated 45° was very similar to the 0° version and is not illustrated for clarity.
Figure 7.
Figure 7.
MUA to familiar targets, novel images, in upright and rotated versions. MUA responses are in the left column for Monkey J and on the right for Monkey O. For Monkey J the MUA response pattern is similar to that seen for LFP (Fig. 6, left column). For Monkey O, only the familiar upright versus novel upright comparison produced significant differences.
Figure 8.
Figure 8.
Broadness of MUA response. For 3 monkeys we calculated the broadness of the MUA response at each of 4 different contrast levels for familiar and novel images. The general response was for novel images to show a higher broadness measure. Stated differently, novel images were more likely to evoke MUA and thus the MUA response was less selective and less specific for novel images than for familiar images.
Figure 9.
Figure 9.
Classification accuracy with LFP traces. At each contrast level and for both familiar and novel images we classified each trial (from 0 to 350 ms after image onset) based on the minimum angle to the mean of all other presentations of the same class and contrast. This measure was insensitive to changes in response magnitude because it was performed on normalized data. Therefore it only reflects similarity in the shape of the LFP response. At each contrast level we classified a greater proportion of familiar image trials than novel image trials.

References

    1. Anderson B, Sanderson MI, Sheinberg DL. Joint decoding of visual stimuli by IT neurons' spike counts is not improved by simultaneous recording. Exp Brain Res. 2007;176:1–11. - PubMed
    1. Anderson B, Sheinberg DL. Effects of temporal context and temporal expectancy on neural activity in inferior temporal cortex. Neuropsychologia. Forthcoming - PMC - PubMed
    1. Brincat SL, Connor CE. Dynamic shape synthesis in posterior inferotemporal cortex. Neuron. 2006;49:17–24. - PubMed
    1. DeAngelis GC, Cumming BG, Newsome WT. Cortical area MT and the perception of stereoscopic depth. Nature. 1998;394:677–680. - PubMed
    1. DeAngelis GC, Newsome WT. Organization of disparity-selective neurons in macaque area MT. J Neurosci. 1999;19:1398–1415. - PMC - PubMed

Publication types