. 2008 Mar;36(5):e34.
doi: 10.1093/nar/gkn083. Epub 2008 Feb 22.

Bisulfite sequencing Data Presentation and Compilation (BDPC) web server--a useful tool for DNA methylation analysis

Affiliations

Bisulfite sequencing Data Presentation and Compilation (BDPC) web server--a useful tool for DNA methylation analysis

Christian Rohde et al. Nucleic Acids Res. 2008 Mar.

Abstract

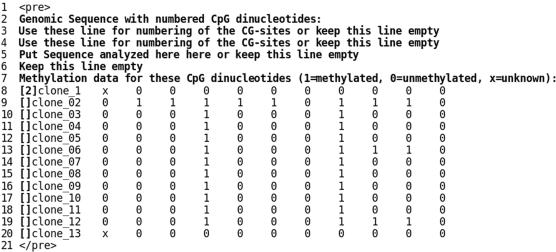
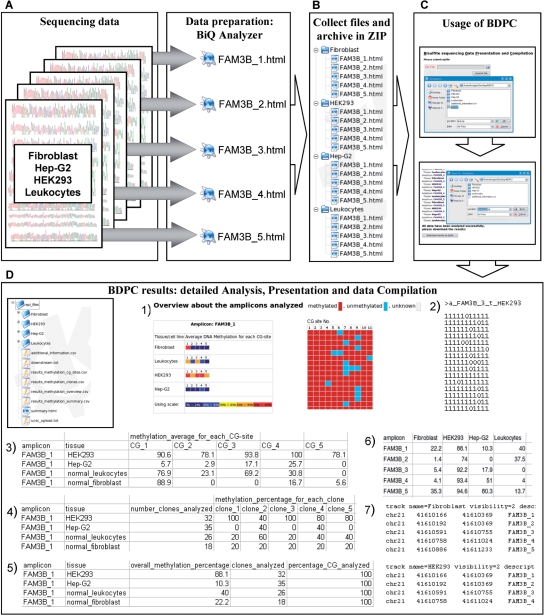
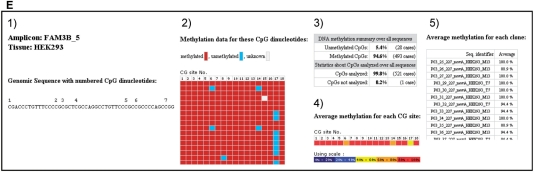
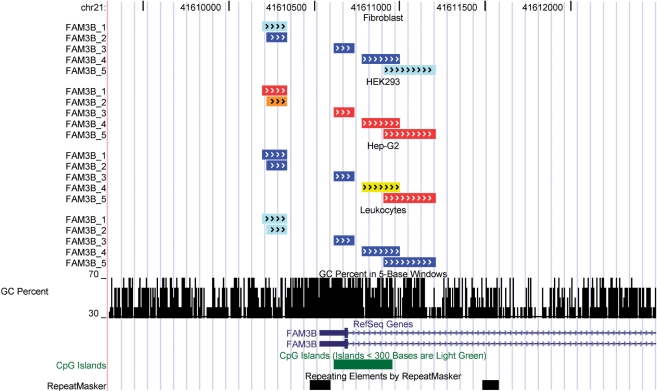
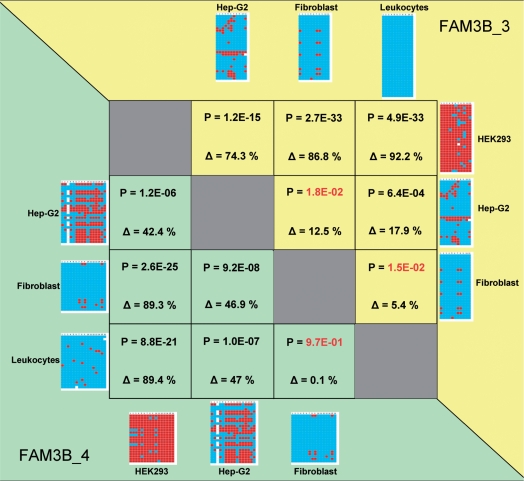
During bisulfite genomic sequencing projects large amount of data are generated. The Bisulfite sequencing Data Presentation and Compilation (BDPC) web interface (http://biochem.jacobs-university.de/BDPC/) automatically analyzes bisulfite datasets prepared using the BiQ Analyzer. BDPC provides the following output: (i) MS-Excel compatible files compiling for each PCR product (a) the average methylation level, the number of clones analyzed and the percentage of CG sites analyzed (which is an indicator of data quality), (b) the methylation level observed at each CG site and (c) the methylation level of each clone. (ii) A methylation overview table compiling the methylation of all amplicons in all tissues. (iii) Publication grade figures in PNG format showing the methylation pattern for each PCR product embedded in an HMTL file summarizing the methylation data, the DNA sequence and some basic statistics. (iv) A summary file compiling the methylation pattern of different tissues, which is linked to the individual HTML result files, and can be directly used for presentation of the data in the internet. (v) A condensed file, containing all primary data in simplified format for further downstream data analysis and (vi) a custom track file for display of the results in the UCSC genome browser.


Figures

Figure 1.
Figure 1.
BDPC compatible data format. For uploading to BDPC, a data file needs the information shown in bold. The example file can be downloaded from the BDPC website in the ‘Example files’ area. For presentation purpose here line numbering is used, which must not be done in the data files. The phrases in lines 2 and 7 are mandatory and must be written exactly as shown here. The lines 3 and 4 can be used for numbering the CG-sites, line 5 to give the sequence analyzed. This information will be carried over into the BDPC output files. In line 8 the ‘[2]’ is mandatory, whereas for the following lines two squared brackets are sufficient. From line 8 on, the results are organized in such a way that each column represents a CG-site and each line the sequencing result of an individual clone. In the results, the ‘1’ represents a methylated CG-site, the ‘0’ an unmethylated CG-site and the ‘x’ a CG-site which is not present. The data is separated with tabs. The HTML tags in line 1 and 21 are not required.
Figure 2.
Figure 2.
Workflow of bisulfite genomic sequencing analysis using BDPC. (A–C) Initial analysis of sequencing data is done using the BiQ Analyzer (A). The data are organized in folders (B) and uploaded to BDPC for analysis and data compilation (C). Afterwards the results can be downloaded in one ZIP file and extracted locally. (D) BDPC generates the following files: 1) The amplicon overview ‘summary.html’ file linked to the primary result HTML files with embedded pictures, 2) the ‘downstream.txt’ file compiling all primary data in one file, 3) the ‘results_methylation_cg_sites.csv’ file, 4) the ‘results_methylation_clones.csv’ file, 5) the ‘results_methylation_summary.csv’ file, 6) the ‘results_methylation_overview.csv’ table comparing the methylation results of all amplicons in all tissues and 7) the ‘ucsc_upload.txt’ file. (E) For each individual PCR product, a presentation ready HTML file is generated, that contains: 1) The sequence analyzed with numbered CG-dinucleotides. 2) The DNA methylation status of each CG-dinucleotide visualized graphically. Here each column corresponds to one CG-site analyzed in the PCR product. Each row represents one subcloned PCR product. Methylated CG-dinucleotides are presented as a red square, unmethylated as a blue square and CG-dinucleotides, which are not present are indicated in white. 3) The DNA methylation summary over all clones and statistics of the presence of CG-dinucleotides. 4) The average methylation level for each CG-site presented in a color-coded picture. 5) The average methylation for each subcloned DNA molecule presented in a table.
Figure 2.
Figure 2.
Workflow of bisulfite genomic sequencing analysis using BDPC. (A–C) Initial analysis of sequencing data is done using the BiQ Analyzer (A). The data are organized in folders (B) and uploaded to BDPC for analysis and data compilation (C). Afterwards the results can be downloaded in one ZIP file and extracted locally. (D) BDPC generates the following files: 1) The amplicon overview ‘summary.html’ file linked to the primary result HTML files with embedded pictures, 2) the ‘downstream.txt’ file compiling all primary data in one file, 3) the ‘results_methylation_cg_sites.csv’ file, 4) the ‘results_methylation_clones.csv’ file, 5) the ‘results_methylation_summary.csv’ file, 6) the ‘results_methylation_overview.csv’ table comparing the methylation results of all amplicons in all tissues and 7) the ‘ucsc_upload.txt’ file. (E) For each individual PCR product, a presentation ready HTML file is generated, that contains: 1) The sequence analyzed with numbered CG-dinucleotides. 2) The DNA methylation status of each CG-dinucleotide visualized graphically. Here each column corresponds to one CG-site analyzed in the PCR product. Each row represents one subcloned PCR product. Methylated CG-dinucleotides are presented as a red square, unmethylated as a blue square and CG-dinucleotides, which are not present are indicated in white. 3) The DNA methylation summary over all clones and statistics of the presence of CG-dinucleotides. 4) The average methylation level for each CG-site presented in a color-coded picture. 5) The average methylation for each subcloned DNA molecule presented in a table.
Figure 3.
Figure 3.
Display of BDPC results in the UCSC genome browser. Here, the position 41 609 300–41 612 500 of the NCBI36 assembly of human chromosome 21 is shown. The picture was generated by uploading the ‘ucsc_upload.txt’ file as a custom track at http://genome.ucsc.edu/cgi-bin/hgGateway. From top to bottom the figure shows methylation levels for different amplicons for HEK293, Leukocytes, Hep-G2, and Fibroblast. The arrows in the annotated PCR product indicate the DNA strand targeted for DNA methylation analysis. The overall DNA methylation level of the products is indicated by color: 0–20% is colored blue, 20.01–40% cyan, 40.01–60% yellow, 60.01–80% orange and 80.01–100% red. In addition, the GC-percentage, the RefSeq gene annotations, the annotated CpG-Islands and the repetitive sequence elements are displayed.
Figure 4.
Figure 4.
Examples of the application of BDPC output files for data presentation. (A) Distribution of methylation levels of individual CG sites on the FAM3B_4 amplicon in different tissues. This diagram was generated using the data compiled in the ‘results_methylation_cg_sites.csv’ file. (B) Overall methylation of clones of the FAM3B_4 amlicon in different tissues. This figure was prepared using the results compiled in the ‘results_methylation_clones.csv’ file by calculating the average methylation in each tissue together with the SE. The figure shows average ± 1 SE as grey box, average ± 2 SE as lines. The broad distribution observed in Hep-G2 is due to a biphasic distribution of methylation levels among the clones (see Figure 5).
Figure 5.
Figure 5.
Pair wise comparison of methylation data obtained for the FAM3B_3 and FAM3B_4 amplicons in different cell lines and tissues. The figure shows the methylation patterns observed in different tissues for two amplicons: FAM3B_3 (in the yellow shaded part) and FAM3B_4 (in the green shaded part). In the table, the pairwise differences of the methylation levels (Δ in percentage) in different tissues and the P-values of the statistical significance of the differences are listed. P-values indicating no significant difference are colored red. The differences in the methylation levels were calculated using the methylation data given in ‘results_methylation_summay.csv’. The P-values are calculated using the methylation levels of individual clones (provided in ‘results_methylation_clones.csv’) using a two-flanked t-test for samples with differing variance.

References

    1. Hermann A, Gowher H, Jeltsch A. Biochemistry and biology of mammalian DNA methyltransferases. Cell. Mol. Life Sci. 2004;61:2571–2587. - PMC - PubMed
    1. Klose RJ, Bird AP. Genomic DNA methylation: the mark and its mediators. Trends Biochem. Sci. 2006;31:89–97. - PubMed
    1. Martin C, Zhang Y. Mechanisms of epigenetic inheritance. Curr. Opin. Cell Biol. 2007;19:266–272. - PubMed
    1. Bird A. DNA methylation patterns and epigenetic memory. Genes Dev. 2002;16:6–21. - PubMed
    1. Li E, Bestor TH, Jaenisch R. Targeted mutation of the DNA methyltransferase gene results in embryonic lethality. Cell. 1992;69:915–926. - PubMed

Publication types