. 2008 May;190(10):3505-25.
doi: 10.1128/JB.01631-07. Epub 2008 Feb 22.

Effects of SecE depletion on the inner and outer membrane proteomes of Escherichia coli

Affiliations

Effects of SecE depletion on the inner and outer membrane proteomes of Escherichia coli

Louise Baars et al. J Bacteriol. 2008 May.

Abstract

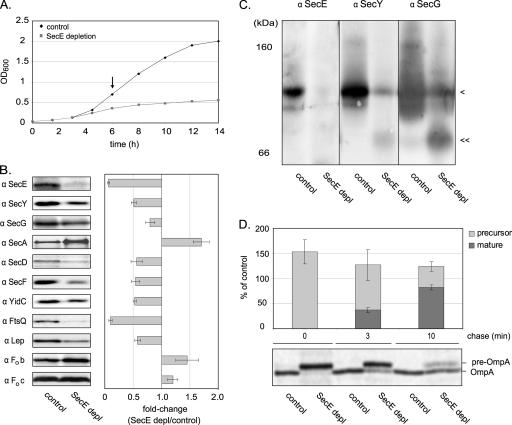
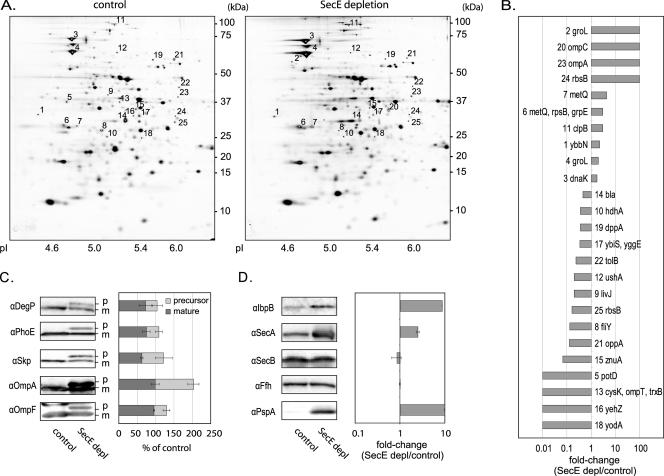
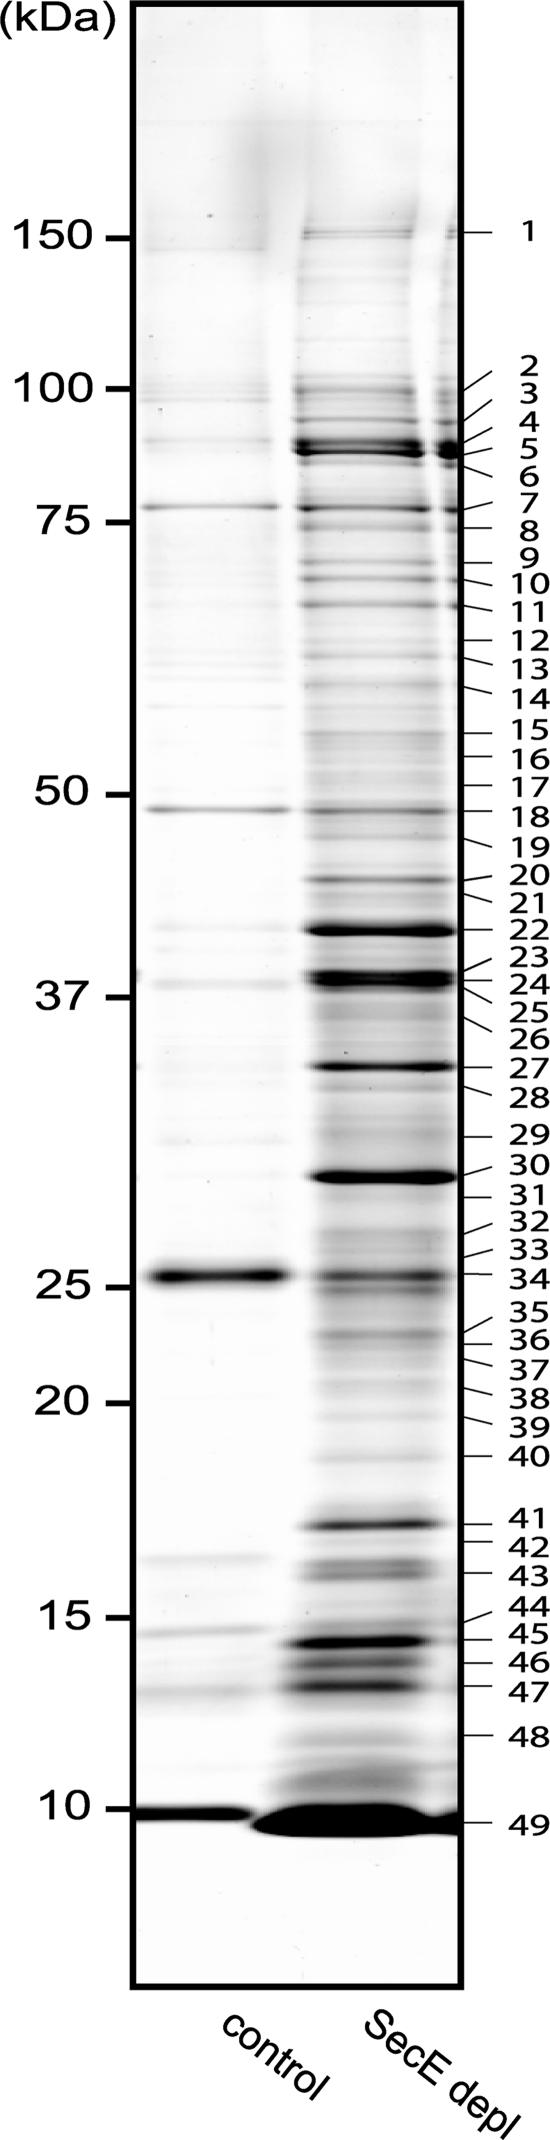
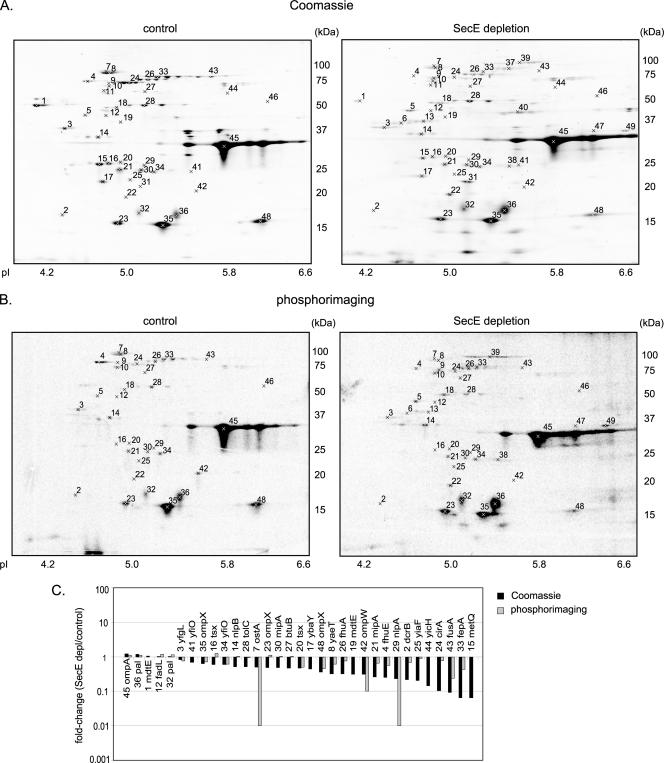
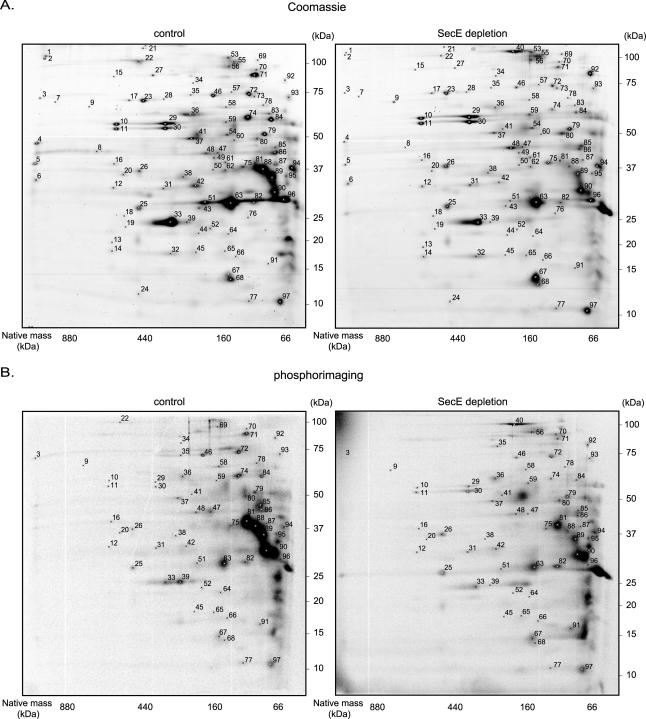
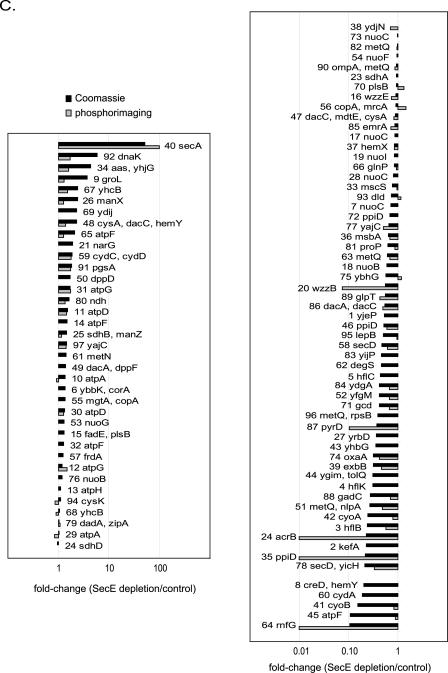
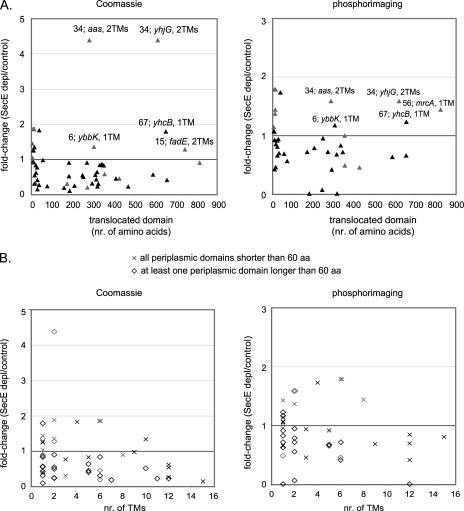
The Sec translocon is a protein-conducting channel that allows polypeptides to be transferred across or integrated into a membrane. Although protein translocation and insertion in Escherichia coli have been studied using only a small set of specific model substrates, it is generally assumed that most secretory proteins and inner membrane proteins use the Sec translocon. Therefore, we have studied the role of the Sec translocon using subproteome analysis of cells depleted of the essential translocon component SecE. The steady-state proteomes and the proteome dynamics were evaluated using one- and two-dimensional gel analysis, followed by mass spectrometry-based protein identification and extensive immunoblotting. The analysis showed that upon SecE depletion (i) secretory proteins aggregated in the cytoplasm and the cytoplasmic sigma(32) stress response was induced, (ii) the accumulation of outer membrane proteins was reduced, with the exception of OmpA, Pal, and FadL, and (iii) the accumulation of a surprisingly large number of inner membrane proteins appeared to be unaffected or increased. These proteins lacked large translocated domains and/or consisted of only one or two transmembrane segments. Our study suggests that several secretory and inner membrane proteins can use Sec translocon-independent pathways or have superior access to the remaining Sec translocons present in SecE-depleted cells.


Figures

FIG. 1.
FIG. 1.
Effect of SecE depletion on growth, steady-state levels of Sec components, model inner membrane proteins, and OmpA translocation. (A) Effect of SecE depletion on cell growth. Growth of CM124 cultured in the presence (control) and absence (SecE depletion) of 0.2% arabinose was monitored by measuring the OD600. (B) Quantification of the steady-state levels of SecE, SecY, SecG, SecA, SecD, SecF, and YidC, as well as the model substrates FtsQ, Lep, Fob, and Foc, in the inner membrane of SecE-depleted (SecE depl) and control cells. Inner membranes from SecE-depleted and control cells were subjected to SDS-PAGE followed by immunoblot analysis with antibodies to the components listed above. The graph indicates the average changes in the intensities of the bands upon SecE depletion compared to the control. The quantification was based on three independent samples. α, antibody. (C) Analysis of the integrity and abundance of the SecYEG complex. Inner membranes from SecE-depleted and control cells were subjected to BN-PAGE analysis followed by detection of SecE, SecY, and SecG by immunoblotting. The position of the SecYEG trimer is indicated by one arrowhead, and the position of the putative SecYG complex is indicated by two arrowheads. (D) Effect of depletion of SecE on the translocation of the major outer membrane protein OmpA. SecE-depleted and control cells were labeled with [35S]methionine for 30 s and, after cold methionine was added, chased for 3 and 10 min. OmpA was immunoprecipitated and subjected to standard SDS-PAGE analysis, and labeled material was detected by phosphorimaging. The bars in the graph indicate the percentages of the precursor and mature forms of OmpA detected in the SecE-depleted cells compared to the amounts of mature OmpA detected in the control cells. The experiment was repeated three times.
FIG. 2.
FIG. 2.
Flow cytometric properties of control and SecE-depleted (SecE depl) cells. SecE-depleted and control cells were analyzed by flow cytometry. (A) Size of the population (forward scatter) plotted versus granularity (side scatter) for SecE-depleted and control cells. The insets show microscope images of representative cells from the SecE-depleted and control cultures. Cell length is indicated by scale bars. (B) Histograms representing the fluorescence of cultures stained with the membrane-specific fluorophore FM4-64.
FIG. 3.
FIG. 3.
Analysis of whole-cell lysates of SecE-depleted and control cells by 2DE and immunoblotting. (A) Comparative 2DE analysis of total lysates from SecE-depleted and control cells. Proteins from 1 OD600 unit of solubilized cells were separated by 2DE. Proteins were visualized by silver staining, and differences between SecE-depleted and control cells were analyzed using PDQuest. Twenty-five spots were significantly (P < 0.05) affected by SecE depletion. Proteins were identified by MALDI-TOF MS and PMF using spots excised from gels stained with Coomassie brilliant blue (Table 1; see Table S1 in the supplemental material). If several proteins were identified in the same spot, the first gene listed corresponds to the gene with the highest Mascot MOWSE score. Primary gene designations were obtained from Swiss-Prot (www.expasy.org). Annotated spots were matched on the silver-stained gels shown using PDQuest. (B) Graph showing the changes in spots that are significantly (P < 0.05) affected by SecE depletion. Changes were calculated by determining the average spot intensities in SecE-depleted samples (SecE depl)/average spot intensities in control samples. A change of 100-fold indicates that a spot was detected only in SecE-depleted samples (“on response”), and a change of 0.01-fold indicates that a spot was detected only in the control samples (“off response”). (C) Quantification of the precursor (p) and mature (m) forms of secretory proteins in SecE-depleted and control cells by immunoblotting. Whole cells were subjected to SDS-PAGE followed by immunoblot analysis with antibodies to two periplasmic proteins (DegP and Skp) and three outer membrane proteins (OmpA, OmpF, and PhoE). The bars in the graph indicate the percentages of the precursor and mature forms of the proteins detected in the SecE-depleted cells compared to the mature form detected in the control cells. The quantification was based on three independent samples. α, antibody. (D) Quantification of the levels of IbpA/B, SecA, Ffh, SecB, and PspA in whole cells. SecE-depleted and control cells were subjected to SDS-PAGE followed by immunoblot analysis with antibodies to the components listed above. The graph shows the changes calculated by determining the average band intensities detected in SecE-depleted cells/average band intensities detected in control cells. The quantification was based on three independent samples.
FIG. 4.
FIG. 4.
Characterization of aggregates isolated from SecE-depleted cells (SecE depl). Aggregates isolated from SecE-depleted and control cells were analyzed by SDS-PAGE. Proteins were stained with colloidal Coomassie brilliant blue and subsequently identified by MALDI-TOF MS and PMF (Table 2; see Table S2 in the supplemental material). If several proteins were identified in the same band, the first gene listed corresponds to the protein with the highest Mascot MOWSE score.
FIG. 5.
FIG. 5.
2DE analysis of the outer membrane proteome from SecE-depleted (SecE depl) and control cells. Cells were labeled with [35S]methionine for 1 min, which was followed by a chase for 10 min with cold methionine. The outer membrane fractions were isolated by density centrifugation from a mixture of labeled and nonlabeled cells as outlined in Fig. S1 in the supplemental material (see Materials and Methods for details). The outer membrane fractions were used for separation by 2DE. Proteins were identified by MALDI-TOF MS and PMF using spots excised from with Coomassie brilliant blue-stained gels (Table 3; see Table S3 in the supplemental material). The outer membrane fraction of SecE-depleted cells was contaminated with aggregates that cosedimented with the outer membrane during density centrifugation (see Table S4 in the supplemental material). The spots corresponding to the proteins in these aggregates were identified and removed from the analysis set as described in Materials and Methods. Differences in the outer membrane proteomes of the SecE-depleted and control cells were analyzed using PDQuest. Significantly affected (P < 0.05) proteins are indicated in Table 3 and in Table S3 in the supplemental material. (A) Representative 2D gels showing proteins in the outer membrane fraction stained with colloidal Coomassie brilliant blue (protein steady-state levels). (B) Representative 2D gels showing proteins in the outer membrane fraction detected by phosphorimaging (protein insertion). (C) Graph showing the changes (average spot intensity for SecE-depleted samples/average spot intensity for control sample) for proteins visualized by Coomassie brilliant blue staining (black bars) and phosphorimaging (gray bars). A change of 100-fold indicates that a spot was detected only in SecE-depleted samples (“on response”), and a change of 0.01-fold indicates that a spot was detected only in the control samples (“off response”). The numbers correspond to spots on the gels in panels A and B.
FIG. 6.
FIG. 6.
2D BN/SDS-PAGE analysis of the inner membrane proteomes of SecE-depleted and control cells. Cells were labeled with [35S]methionine for 1 min, which was followed by a chase for 10 min with cold methionine. The inner membrane fractions were isolated by density centrifugation from a mixture of labeled and nonlabeled cells as outlined in Fig. S1 in the supplemental material (see Materials and Methods for details). The inner membrane fractions were analyzed by 2D BN/SDS-PAGE. Proteins were identified by MALDI-TOF MS and PMF (Table 4; see Table S4 in the supplemental material) using spots excised from Coomassie brilliant blue-stained gels. If several proteins were identified in one spot, the first gene listed corresponds to the protein with the highest Mascot MOWSE score. Primary gene designations were obtained from Swiss-Prot (www.expasy.org). Differences in the inner membrane proteomes of SecE-depleted and control cells were analyzed using PDQuest. Significantly affected (P < 0.05) proteins are indicated in Table 4 and in Table S4 in the supplemental material. (A) Representative 2D BN/SDS-PAGE gels with proteins detected by staining with colloidal Coomassie brilliant blue (protein steady-state levels). (B) Representative 2D BN/SDS-PAGE gels with proteins detected by phosphorimaging (protein insertion). (C) Graph showing the changes (average spot intensities for SecE-depleted samples/average spot intensities for control samples) for proteins detected by Coomassie brilliant blue staining (black bars) and phosphorimaging (gray bars). A change of 100-fold indicates a spot that was detected only in SecE-depleted samples (“on response”), and a change of 0.01-fold indicates that a spot was detected only in the control samples (“off response”). The numbers correspond to spots on the gels in panels A and B.
FIG. 6.
FIG. 6.
2D BN/SDS-PAGE analysis of the inner membrane proteomes of SecE-depleted and control cells. Cells were labeled with [35S]methionine for 1 min, which was followed by a chase for 10 min with cold methionine. The inner membrane fractions were isolated by density centrifugation from a mixture of labeled and nonlabeled cells as outlined in Fig. S1 in the supplemental material (see Materials and Methods for details). The inner membrane fractions were analyzed by 2D BN/SDS-PAGE. Proteins were identified by MALDI-TOF MS and PMF (Table 4; see Table S4 in the supplemental material) using spots excised from Coomassie brilliant blue-stained gels. If several proteins were identified in one spot, the first gene listed corresponds to the protein with the highest Mascot MOWSE score. Primary gene designations were obtained from Swiss-Prot (www.expasy.org). Differences in the inner membrane proteomes of SecE-depleted and control cells were analyzed using PDQuest. Significantly affected (P < 0.05) proteins are indicated in Table 4 and in Table S4 in the supplemental material. (A) Representative 2D BN/SDS-PAGE gels with proteins detected by staining with colloidal Coomassie brilliant blue (protein steady-state levels). (B) Representative 2D BN/SDS-PAGE gels with proteins detected by phosphorimaging (protein insertion). (C) Graph showing the changes (average spot intensities for SecE-depleted samples/average spot intensities for control samples) for proteins detected by Coomassie brilliant blue staining (black bars) and phosphorimaging (gray bars). A change of 100-fold indicates a spot that was detected only in SecE-depleted samples (“on response”), and a change of 0.01-fold indicates that a spot was detected only in the control samples (“off response”). The numbers correspond to spots on the gels in panels A and B.
FIG. 7.
FIG. 7.
Correlations between properties of inner membrane proteins and the effect on their steady-state levels and insertion upon SecE depletion. (A) Changes in steady-state levels (Coomassie brilliant blue staining) and insertion (phosphorimaging) plotted against the number of amino acids in the largest translocated domain of each protein (see Table S5 in the supplemental material). Black symbols represent proteins identified in spots containing only one protein, while gray symbols represent proteins identified in spots containing more than one protein. Almost all proteins that appeared to be positively affected by SecE depletion do not contain any large periplasmic domains. Exceptions to this trend are indicated on the plots by gene designations and the number of predicted transmembrane segments (TMs). SecE depl, SecE-depleted cells; aa, amino acids. (B) Proteins were divided into two groups: proteins with large translocated domains (≥60 amino acids) and proteins with small translocated domains (≤60 amino acids). The changes upon SecE depletion for these two groups were plotted against the number of transmembrane segments (see Table S5 in the supplemental material). Black symbols represent proteins identified in spots containing only one protein, while gray symbols represent proteins identified in spots containing more than one protein.

References

    1. Akiyama, Y., A. Kihara, H. Tokuda, and K. Ito. 1996. FtsH (HflB) is an ATP-dependent protease selectively acting on SecY and some other membrane proteins. J. Biol. Chem. 27131196-31201. - PubMed
    1. Alami, M., K. Dalal, B. Lelj-Garolla, S. G. Sligar, and F. Duong. 2007. Nanodiscs unravel the interaction between the SecYEG channel and its cytosolic partner SecA. EMBO J. 261995-2004. - PMC - PubMed
    1. Andersson, H., and G. von Heijne. 1993. Sec dependent and Sec independent assembly of E. coli inner membrane proteins: the topological rules depend on chain length. EMBO J. 12683-691. - PMC - PubMed
    1. Arsene, F., T. Tomoyasu, and B. Bukau. 2000. The heat shock response of Escherichia coli. Int. J. Food Microbiol. 553-9. - PubMed
    1. Baars, L., A. J. Ytterberg, D. Drew, S. Wagner, C. Thilo, K. J. van Wijk, and J. W. de Gier. 2006. Defining the role of the Escherichia coli chaperone SecB using comparative proteomics. J. Biol. Chem. 28110024-10034. - PubMed

Publication types

MeSH terms

LinkOut - more resources