. 2008 Apr;74(8):2534-6.
doi: 10.1128/AEM.02402-07. Epub 2008 Feb 22.

Single-cell and population lag times as a function of cell age

Affiliations

Single-cell and population lag times as a function of cell age

Carmen Pin et al. Appl Environ Microbiol. 2008 Apr.

Abstract

After inoculation, the times to the first divisions are longer and more widely distributed for those Escherichia coli single cells that spent more time in the stationary phase prior to inoculation. The second generation times are still longer than the typical generation times in the exponential phase, and this extended the apparent lag time of the cell population. The greater the variability of the single-cell interdivision intervals, the shorter are both the lag time and the doubling time of the population.


Figures

FIG. 1.
FIG. 1.
Box-and-whiskers plots representing the distributions of the logarithm of the FDT (a) and of the second generation time (b) of single cells kept in the stationary phase for different periods of time prior to inoculation. A “+” represents the average; a notch represents the median. Outliers that were more than 1.5 or 3 times the interquartile range above or below the box are shown as small squares or small squares with “+” signs through them, respectively.
FIG. 2.
FIG. 2.
Relationship between the average of the single-cell FDTs and the sum of the lag (L) and doubling times of the population (Dtp) (L + Dtp). The growth of a population with 100 initial cells was simulated for each inoculum age based on the distributions of the observed single-cell generation times as described in reference .
FIG. 3.
FIG. 3.
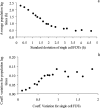
Effect of the variability of the single-cell FDTs on the population lag time (a) and the relationship between the CV (coeff. variation) values of the population lag time and of the FDTs of the single cells (b).
FIG. 4.
FIG. 4.
Relationship between the population doubling times and the variability of the generation times of single cells in the exponential phase. Comparison of scenarios when all cells divide synchronously and exactly every 0.66 h and when the generation times are distributed according to a gamma distribution with an expected value equal to 0.66 h and a standard deviation that varies from ca. 0.1 to 2 times the mean value.

References

    1. Augustin, J. C., A. Brouillaud-Delattre, L. Rosso, and V. Carlier. 2000. Significance of inoculum size in the lag time of Listeria monocytogenes. Appl. Environ. Microbiol. 66:1706-1710. - PMC - PubMed
    1. Baranyi, J. 1998. Comparison of stochastic and deterministic concepts of bacterial lag. J. Theor. Biol. 192:403-408. - PubMed
    1. Baranyi, J., and C. Pin. 2001. A parallel study on bacterial growth and inactivation. J. Theor. Biol. 210:327-336. - PubMed
    1. D'Arrigo, M., G. D. Garcia de Fernando, R. Velasco de Diego, J. A. Ordonez, S. M. George, and C. Pin. 2006. Indirect measurement of the lag time distribution of single cells of Listeria innocua in food. Appl. Environ. Microbiol. 72:2533-2538. - PMC - PubMed
    1. Elfwing, A., Y. LeMarc, J. Baranyi, and A. Ballagi. 2004. Observing growth and division of large numbers of individual bacteria by image analysis. Appl. Environ. Microbiol. 70:675-678. - PMC - PubMed

Publication types

LinkOut - more resources