

Beyond good and evil in the oral cavity: insights into host-microbe relationships derived from transcriptional profiling of gingival cells
- PMID: 18296603
- PMCID: PMC2633067
- DOI: 10.1177/154405910808700302
Beyond good and evil in the oral cavity: insights into host-microbe relationships derived from transcriptional profiling of gingival cells
Abstract
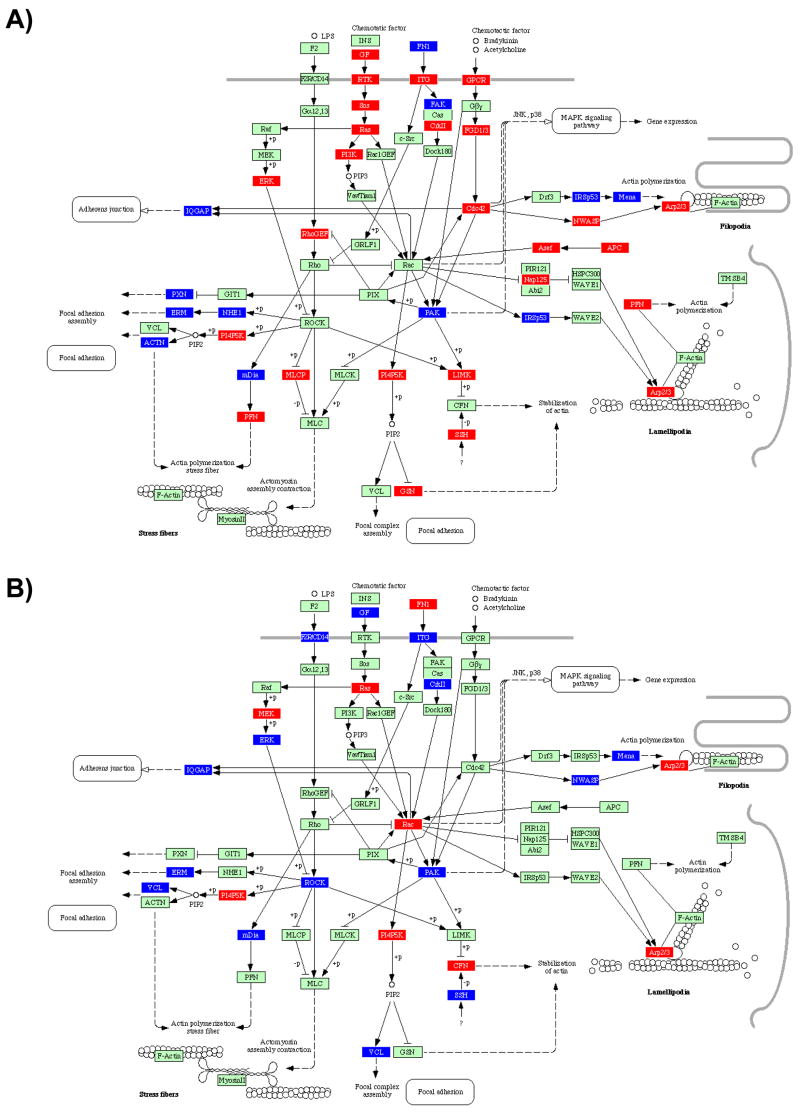
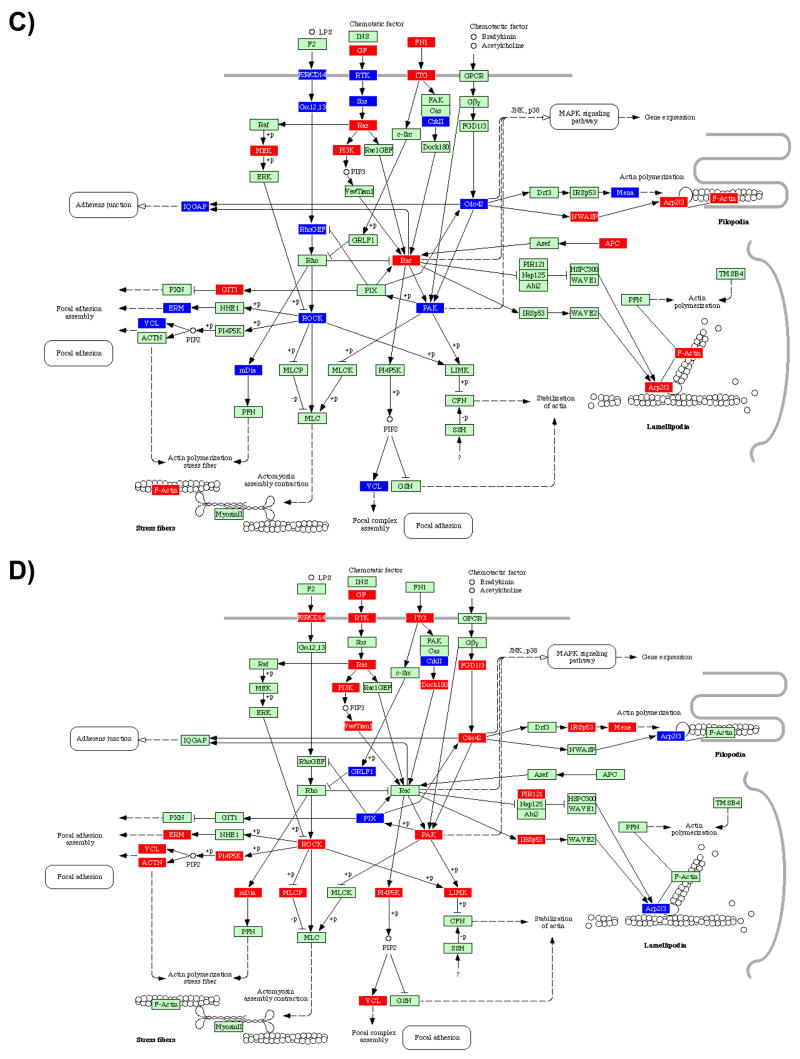
In many instances, the encounter between host and microbial cells, through a long-standing evolutionary association, can be a balanced interaction whereby both cell types co-exist and inflict a minimal degree of harm on each other. In the oral cavity, despite the presence of large numbers of diverse organisms, health is the most frequent status. Disease will ensue only when the host-microbe balance is disrupted on a cellular and molecular level. With the advent of microarrays, it is now possible to monitor the responses of host cells to bacterial challenge on a global scale. However, microarray data are known to be inherently noisy, which is caused in part by their great sensitivity. Hence, we will address several important general considerations required to maximize the significance of microarray analysis in depicting relevant host-microbe interactions faithfully. Several advantages and limitations of microarray analysis that may have a direct impact on the significance of array data are highlighted and discussed. Further, this review revisits and contextualizes recent transcriptional profiles that were originally generated for the specific study of intricate cellular interactions between gingival cells and 4 important plaque micro-organisms. To our knowledge, this is the first report that systematically investigates the cellular responses of a cell line to challenge by 4 different micro-organisms. Of particular relevance to the oral cavity, the model bacteria span the entire spectrum of documented pathogenic potential, from commensal to opportunistic to overtly pathogenic. These studies provide a molecular basis for the complex and dynamic interaction between the oral microflora and its host, which may lead, ultimately, to the development of novel, rational, and practical therapeutic, prophylactic, and diagnostic applications.
Figures

Similar articles
-
The degree of microbiome complexity influences the epithelial response to infection.BMC Genomics. 2009 Aug 18;10:380. doi: 10.1186/1471-2164-10-380. BMC Genomics. 2009. PMID: 19689803 Free PMC article.
-
Commensal and Pathogenic Biofilms Alter Toll-Like Receptor Signaling in Reconstructed Human Gingiva.Front Cell Infect Microbiol. 2019 Aug 7;9:282. doi: 10.3389/fcimb.2019.00282. eCollection 2019. Front Cell Infect Microbiol. 2019. PMID: 31448244 Free PMC article.
-
Saliva-Derived Commensal and Pathogenic Biofilms in a Human Gingiva Model.J Dent Res. 2018 Feb;97(2):201-208. doi: 10.1177/0022034517729998. Epub 2017 Sep 11. J Dent Res. 2018. PMID: 28892653 Free PMC article.
-
Single-Cell RNA Sequencing to Understand Host-Pathogen Interactions.ACS Infect Dis. 2019 Mar 8;5(3):336-344. doi: 10.1021/acsinfecdis.8b00369. Epub 2019 Jan 31. ACS Infect Dis. 2019. PMID: 30702856 Review.
-
Microarray analysis of human epithelial cell responses to bacterial interaction.Infect Disord Drug Targets. 2006 Sep;6(3):299-309. doi: 10.2174/187152606778249926. Infect Disord Drug Targets. 2006. PMID: 16918488 Review.
Cited by
-
Prolyl hydroxylase inhibitor DMOG suppressed inflammatory cytokine production in human gingival fibroblasts stimulated with Fusobacterium nucleatum.Clin Oral Investig. 2019 Jul;23(7):3123-3132. doi: 10.1007/s00784-018-2733-2. Epub 2018 Nov 8. Clin Oral Investig. 2019. PMID: 30411281
-
Porphyromonas gingivalis infection-induced tissue and bone transcriptional profiles.Mol Oral Microbiol. 2010 Feb;25(1):61-74. doi: 10.1111/j.2041-1014.2009.00555.x. Mol Oral Microbiol. 2010. PMID: 20331794 Free PMC article.
-
Polymicrobial synergy and dysbiosis in inflammatory disease.Trends Mol Med. 2015 Mar;21(3):172-83. doi: 10.1016/j.molmed.2014.11.004. Epub 2014 Nov 20. Trends Mol Med. 2015. PMID: 25498392 Free PMC article. Review.
-
Adhesion of streptococci to titanium and zirconia.PLoS One. 2020 Jun 24;15(6):e0234524. doi: 10.1371/journal.pone.0234524. eCollection 2020. PLoS One. 2020. PMID: 32579584 Free PMC article.
-
Epithelial cell innate response to Candida albicans.Adv Dent Res. 2011 Apr;23(1):50-5. doi: 10.1177/0022034511399285. Adv Dent Res. 2011. PMID: 21441481 Free PMC article. Review.
References
-
- Abraham SN, Duncan MJ, Li G, Zaas D. Bacterial penetration of the mucosal barrier by targeting lipid rafts. J Investig Med. 2005;53:318–321. - PubMed
-
- Abreu MT, Vora P, Faure E, Thomas LS, Arnold ET, Arditi M. Decreased expression of Toll-like receptor-4 and MD-2 correlates with intestinal epithelial cell protection against dysregulated proinflammatory gene expression in response to bacterial lipopolysaccharide. J Immunol. 2001;167:1609–1616. - PubMed
-
- Akira S, Takeda K. Toll-like receptor signalling. Nat Rev Immunol. 2004;4:499–511. - PubMed
Publication types
MeSH terms
Grants and funding
LinkOut - more resources
Full Text Sources
