. 2008 Mar 4;105(9):3274-9.
doi: 10.1073/pnas.0712235105. Epub 2008 Feb 22.

PDCD4 inhibits translation initiation by binding to eIF4A using both its MA3 domains

Affiliations

PDCD4 inhibits translation initiation by binding to eIF4A using both its MA3 domains

Chikako Suzuki et al. Proc Natl Acad Sci U S A. .

Abstract

Programmed Cell Death 4 (PDCD4) is a protein known to bind eukaryotic initiation factor 4A (eIF4A), inhibit translation initiation, and act as a tumor suppressor. PDCD4 contains two C-terminal MA3 domains, which are thought to be responsible for its inhibitory function. Here, we analyze the structures and inhibitory functions of these two PDCD4 MA3 domains by x-ray crystallography, NMR, and surface plasmon resonance. We show that both MA3 domains are structurally and functionally very similar and bind specifically to the eIF4A N-terminal domain (eIF4A-NTD) using similar binding interfaces. We found that the PDCD4 MA3 domains compete with the eIF4G MA3 domain and RNA for eIF4A binding. Our data provide evidence that PDCD4 inhibits translation initiation by displacing eIF4G and RNA from eIF4A. The PDCD4 MA3 domains act synergistically to form a tighter and more stable complex with eIF4A, which explains the need for two tandem MA3 domains.


Conflict of interest statement

The authors declare no conflict of interest.

Figures
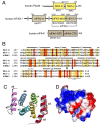
Fig. 1.
Fig. 1.
Domain architectures, sequence alignments, and the crystal structure of PDCD4 MA3-m. (A) Schematic diagram showing the domain architectures of the proteins used in this study. (B) Alignment of PDCD4 MA3-m, MA3-c, and eIF4G-MA3. Amino acids that are highly conserved (red box) among domains and those with strong (orange box) and moderate (yellow box) similarity are indicated. Bars above the sequence indicate α-helical regions; the numbering is based on the MA3-m crystal structure. The shaded bar under the sequences indicates helix α9 in eIF4G-MA3. Arrows point to amino acid residues that are essential for eIF4A binding (16). (C) Ribbon diagrams showing the eight α-helical structure of MA3-m. (D) Electrostatic potential surface rendering of MA3-m. Blue and red regions indicate positive and negative surface potentials, respectively.
Fig. 2.
Fig. 2.
Both PDCD4 MA3 domains bind to eIF4A-NTD but not to eIF4A-CTD. (A and C). Overlays of [15N,1H]TROSY-HSQC spectra of 15N-labeled MA3-m (150 μM) with increasing amount of nonlabeled eIF4A-NTD (A) or eIF4A-CTD (C). Concentrations of eIF4A-NTD/CTD added were 0 μM (red), 150 μM (MA3-m/eIF4A = 1:1 ratio, purple), and 300 μM (MA3-m/eIF4A = 1:2 ratio, blue). (B and D) Overlays of [1H,15N]TROSY-HSQC spectra of 15N-labeled MA3-c (150 μM) with increasing amount of eIF4A-NTD (B) or eIF4A-CTD (D). Concentrations of 0 μM (red), 150 μM (purple), and 300 μM (blue) are shown. Regions with the most distinct chemical shift changes observed are enlarged in the side box.
Fig. 3.
Fig. 3.
Interfaces of PDCD4-MA3 domains for eIF4A-NTD binding. (A) Normalized chemical shift differences in free MA3-m (Upper) or MA3-c (Lower) and its complex with eIF4A-NTD. The horizontal dashed line represents the calculated average chemical shift perturbations. The solid line marks the summation of the average and the standard deviation of the chemical shift differences. *, missing resonances that were not visible in the spectra; (p), proline. (B and C). Amino acid residues that showed distinct chemical shift differences are mapped on MA3-m (B) and MA3-c (C) 3D structures. The ribbon (Upper) and the surface (Lower) representations are shown, respectively. The residues with the most significant chemical shift perturbations are colored in red, whereas those with moderate chemical shift perturbation are colored in orange. Residues that are not visible in the spectrum but are considered to be involved in the binding are shown in black.
Fig. 4.
Fig. 4.
Effect of single MA3 domain versus double MA3 domains for binding to eIF4A fragments by SPR. (A) Binding analysis of eIF4A-FL and PDCD4 MA3 domains. (Upper) Sensorgrams were obtained by passing 50 μM eIF4A-FL over immobilized MA3-dual (red), MA3-m (blue), and MA3-c (magenta) individually. (Lower) Sensorgrams were obtained by passing 50 μM eIF4A-FL (red), 100 μM eIF4A-NTD (blue), 100 μM eIF4A-CTD (magenta), and blank (no protein, gray) over immobilized MA3-dual. Each sensorgram was corrected by subtracting a sensorgram obtained from a reference flow cell. (B) Various concentrations of eIF4A-FL were passed over a sensor chip with immobilized PDCD4 MA3-dual, showing the steady-state interaction between eIF4A-FL and MA3-dual. (C and D) Various concentrations of eIF4A-FL (C) and eIF4A-NTD (D) were passed over immobilized single MA3 domain (MA3-m, open squares) or tandem MA3 domains (MA3-dual, filled squares). Average increases in RU are plotted onto figures.
Fig. 5.
Fig. 5.
Model for eIF4A binding and inhibition by PDCD4. (A) Binding model between MA3-m and eIF4A-FL based on NMR and SPR analysis. The solid arrow shows the interaction between eIF4A-NTD and MA3-m. The dashed arrow shows the predicted interaction between eIF4A-CTD and MA3-m. The binding interface for eIF4A-CTD was predicted based on the interaction between eIF4G-MA3 and eIF4A-CTD (A.M., C.S., K.A.E., and G.W., unpublished work). (B) Model for binding between PDCD4 MA3-dual and eIF4A-FL. Binding interfaces for eIF4A-NTD and CTD are marked as N and C, respectively. Because the 1:1 complex (Upper) could leave one free eIF4A-NTD-binding surface on PDCD4 and one putative eIF4A-CTD-binding surface, a 1:2 complex is also possible. (C) Model for inhibition of eIF4A by PDCD4. (i) eIF4A binds to both eIF4G-MA3 and eIF4G-m in the presence of RNA and ATP. (ii) When the PDCD4 MA3 domain binds, eIF4G-MA3 and RNA are displaced from the eIF4A-NTD but not eIF4A-CTD. (iii) PDCD4 forms an inactive complex with eIF4A and eIF4G and inhibits eIF4A helicase activity. PDCD4 also binds eIF4G-m, possibly mediated by the N-terminal region of PDCD4. The PDCD4-eIF4G-m interaction could be stabilizing the complex, thus enhancing the inhibition effect.

References

    1. Shibahara K, et al. Isolation of a novel mouse gene MA-3 that is induced upon programmed cell death. Gene. 1995;166:297–301. - PubMed
    1. Jansen AP, Camalier CE, Stark C, Colburn NH. Characterization of programmed cell death 4 in multiple human cancers reveals a novel enhancer of drug sensitivity. Mol Cancer Ther. 2004;3:103–110. - PubMed
    1. Dorrello NV, et al. S6K1- and betaTRCP-mediated degradation of PDCD4 promotes protein translation and cell growth. Science. 2006;314:467–471. - PubMed
    1. Goke A, et al. DUG is a novel homologue of translation initiation factor 4G that binds eIF4A. Biochem Biophys Res Commun. 2002;297:78–82. - PubMed
    1. Kang MJ, et al. Up-regulation of PDCD4 in senescent human diploid fibroblasts. Biochem Biophys Res Commun. 2002;293:617–621. - PubMed

Publication types

MeSH terms

Associated data