. 2008 Mar;26(3):343-51.
doi: 10.1038/nbt1387. Epub 2008 Feb 24.

Large-scale chemical dissection of mitochondrial function

Affiliations

Large-scale chemical dissection of mitochondrial function

Bridget K Wagner et al. Nat Biotechnol. 2008 Mar.

Erratum in

  • Nat Biotechnol. 2008 Jul;26(7):831

Abstract

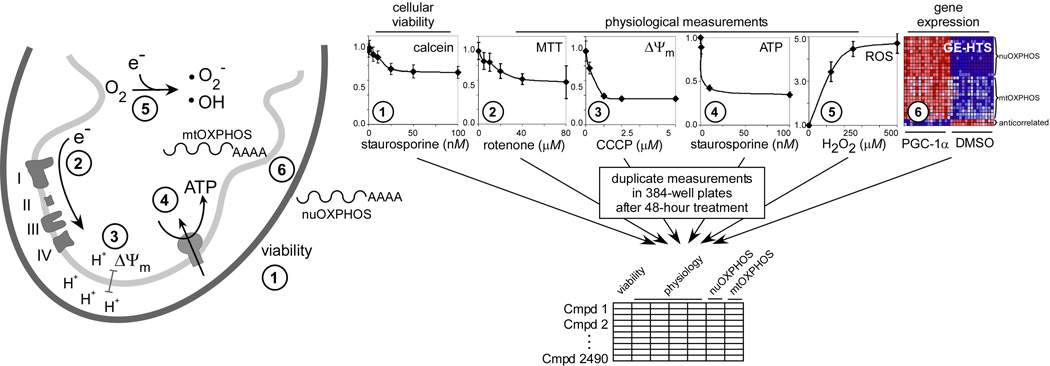
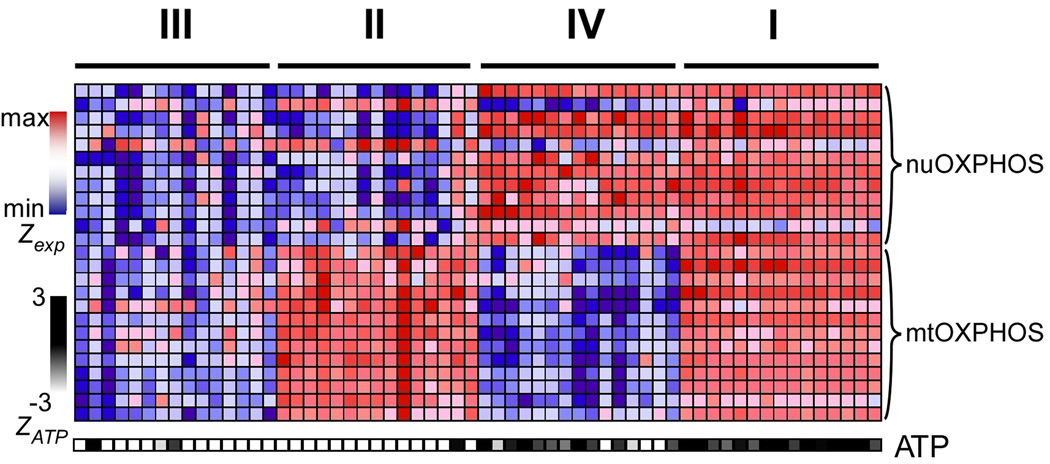
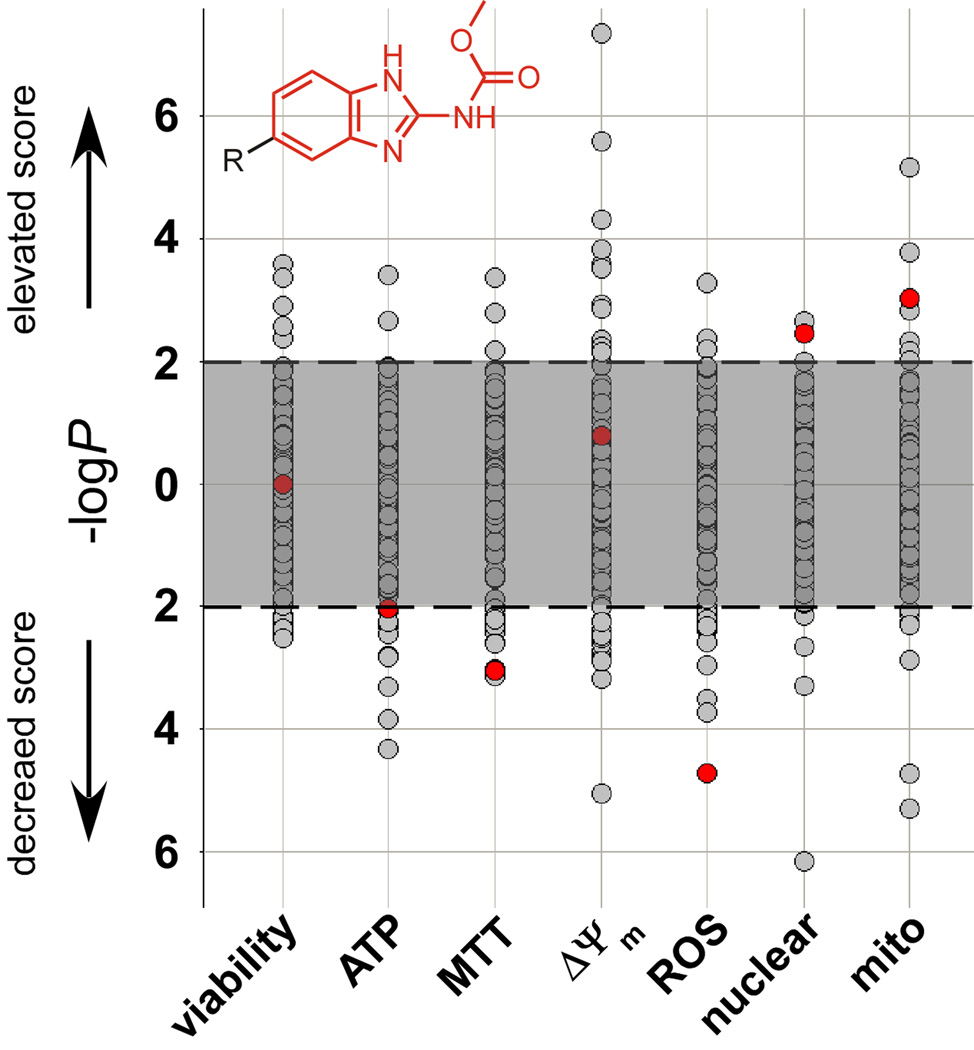
Mitochondrial oxidative phosphorylation (OXPHOS) is under the control of both mitochondrial (mtDNA) and nuclear genomes and is central to energy homeostasis. To investigate how its function and regulation are integrated within cells, we systematically combined four cell-based assays of OXPHOS physiology with multiplexed measurements of nuclear and mtDNA gene expression across 2,490 small-molecule perturbations in cultured muscle. Mining the resulting compendium revealed, first, that protein synthesis inhibitors can decouple coordination of nuclear and mtDNA transcription; second, that a subset of HMG-CoA reductase inhibitors, combined with propranolol, can cause mitochondrial toxicity, yielding potential clues about the etiology of statin myopathy; and, third, that structurally diverse microtubule inhibitors stimulate OXPHOS transcription while suppressing reactive oxygen species, via a transcriptional mechanism involving PGC-1alpha and ERRalpha, and thus may be useful in treating age-associated degenerative disorders. Our screening compendium can be used as a discovery tool both for understanding mitochondrial biology and toxicity and for identifying novel therapeutics.


Figures

Figure 1
Figure 1. Complementary profiles of mitochondrial physiology and mitochondrial gene expression across 2490 chemical perturbations
Multiple assays were used to monitor OXPHOS function and regulation over a large collection of chemical perturbations. Calcein (1) measures cell viability and is used to filter out compounds with obvious toxicity effects, with the protein kinase inhibitor staurosporine used as a positive control. The MTT assay (2) measures cellular dehydrogenase activity, primarily from the electron transport chain; rotenone, a complex I inhibitor, was used to decrease MTT activity. The JC-1 assay (3) measures the mitochondrial membrane potential (ΔΨm), and is inhibited acutely (1 hour) by the addition of the uncoupler CCCP. A commercially available kit is used to measure ATP (4) levels through luciferase activity; staurosporine drops ATP levels in a dose-dependent manner. CM-H2DCFDA measures cellular ROS levels (5), which are generated primarily in the mitochondria. Hydrogen peroxide increases this measurement in a dose-dependent manner. The expression of both nuclear and mitochondrial OXPHOS genes is measured by a multiplex PCR technique called GE-HTS (6). Each column represents one sample from a 384-well plate; expression levels for each gene are represented as a row-normalized heat map. The assay can readily distinguish the expression of control, DMSO-treated cells versus those cells expressing PGC-1α, an inducer of mitochondrial biogenesis. Each assay was performed in biological duplicate following 48 hour treatment with each of 2490 small molecules. The data from both physiological and gene expression-based assays were incorporated into the screening compendium.
Figure 2
Figure 2. Coupling of nuclear and mitochondrial OXPHOS expression
(a) The GE-HTS assay design allowed us to separate gene-expression scores into those specific for nuclear- and mitochondrial-encoded OXPHOS genes (nuOXPHOS and mtOXPHOS, respectively). A two-dimensional plot of the composite Z-scores for nuOXPHOS and mtOXPHOS expression is shown. (b) Row-normalized heat map displaying the top fifteen compounds in each quadrant, with the same numbering indicated in ‘a’. nuOXPHOS and mtOXPHOS transcripts are shown above a heat map indicating cellular ATP levels. (c) Real-time PCR validation of select compounds at the indicated doses, using Atp5a1 (nuOXPHOS) and mt-CoI (mtOXPHOS) normalized to Hprt (internal control). Values indicate average fold change from mock-treated (DMSO) wells ± standard deviation in four biological replicates.
Figure 3
Figure 3. Statin induced mitochondrial toxicity
(a) Six of the HMG-CoA reductase inhibitors (statins) in clinical use are in the chemical screening collection. Composite Z-scores for cell viability, ATP generation, MTT activity, ΔΨm, ROS generation, and gene expression are shown, where negative scores indicate a decrease in signal compared to mock-treated (DMSO) wells. The gray shading indicates scores that fall within the noise envelope. (b) A centroid statin score was generated by calculating the arithmetic means of the composite Z-scores for the class of compounds comprised of fluvastatin, lovastatin, and simvastatin. The ten nearest-neighbor clinically used drugs (amoxapine, cyclobenzaprine, propranolol, griseofulvin, pentamidine, paclitaxel, propafenone, ethaverine, trimeprazine, and amitriptyline) were identified by calculating the root-mean-square distance of each performance vector to the profile of interest. (c) All six statins in our collection were tested in combination with three clinically used beta adrenergic blockers for their effects on cellular ATP levels in C2C12 myotubes. Compound concentrations are indicated on each axis of the heatmap, and the color indicates the change in ATP levels (ranging from black, for no change in cellular ATP levels, to yellow, for a 50% decrease in ATP levels). Data represent the average of six independent wells; coefficients of variation were all below 15%.
Figure 4
Figure 4. Mining the compendium for small molecules that boost OXPHOS gene expression and decrease ROS levels
We used two complementary strategies to identify compounds in the screening compendium that elevate OXPHOS expression while suppressing ROS generation. (a) Mining the compendium for sets of structurally related compounds that boost OXPHOS expression and drop ROS levels. All compounds were organized into 624 clusters based on several chemical descriptors (molecular weight, log P, number of hydrogen bond donors and acceptors, and number of rotatable bonds), and Mann-Whitney rank sum statistics for each cluster and each assay were calculated. The significance of each cluster in each assay is shown, with points above zero indicating positive scores, and points below zero showing negative composite scores. A nominal p = 0.01 is delimited by the dashed lines, and the shaded area indicates the noise envelope. The red data points spotlight a single cluster that is significant for increased OXPHOS gene expression and decreased ROS. The chemical scaffold shared amongst the members of this cluster is shown in red. (b) Mining the compendium for individual compounds that give rise to desired assay profiles. We queried the compendium for compounds that boost OXPHOS expression and drop ROS levels. The distribution of ROS scores are shown for all compounds (gray), as well as for compounds associated with the highest OXPHOS gene expression (black). The latter follow a bimodal distribution, and the smaller mode (bracketed) contains six compounds that elevate OXPHOS expression and decrease ROS levels. The chemical structures of the compounds with the greatest decrease in ROS generation are shown. Five of these six compounds are known to be inhibitors of microtubules.
Figure 5
Figure 5. Secondary analyses of the effects of microtubule inhibitors on OXPHOS gene expression and physiology
(a) Compounds indicated in Figure 4b were re-tested at 20 nM, 200 nM, 2 µM, and 20 µM. Row-normalized gene expression levels of each gene are represented as a heat map. Beneath the heat map, dose-response analysis of ROS generation and viability are provided. No significant decrease in cell viability was observed (shaded area indicates the noise envelope, where p > 0.05). All data shown are the results of four biological replicates per concentration. (b) mtDNA:nuDNA copy number analysis following treatment with four of the compounds (“deo”, deoxysappanone B; “meb”, mebendazole; “noc”, nocodazole; “pac”, paclitaxel), using quantitative PCR analysis of three biological replicates. Data are expressed as the fold increase in copy number relative to DMSO treatment alone. (c) Quantitative PCR measurement of PGC-1α gene expression, in response to either DMSO alone (“Con”), 5 µM deoxysappanone B (“deo”), or 1 µM mebendazole (“meb”). (d) Quantitative PCR measurement of the nuclear OXPHOS gene ATP5a1. Cells were either treated with compound alone (black bars) or in combination with 5 µM of the ERRα inverse agonist XCT790 (gray bars). (e) Quantitative PCR measurement of the ROS scavenger MnSOD, as in ‘d’. Means and standard deviations of expression data are the result of four biological replicates.
Figure 6
Figure 6
Figure 7
Figure 7
Figure 8
Figure 8
Figure 9
Figure 9
Figure 10
Figure 10
Figure 11
Figure 11
Figure 12
Figure 12
Figure 13
Figure 13
Figure 14
Figure 14

Comment in

References

    1. Anderson S, et al. Sequence and organization of the human mitochondrial genome. Nature. 1981;290:457–465. - PubMed
    1. Chance B, Williams GR. Respiratory enzymes in oxidative phosphorylation. III. The steady state. J. Biol. Chem. 1955;217:409–427. - PubMed
    1. DiMauro S, Schon EA. Mitochondrial respiratory-chain diseases. N. Engl. J. Med. 2003;348:2656–2668. - PubMed
    1. Mootha VK, et al. PGC-1alpha-responsive genes involved in oxidative phosphorylation are coordinately downregulated in human diabetes. Nat. Genet. 2003;34:267–273. - PubMed
    1. Petersen KF, et al. Mitochondrial dysfunction in the elderly: possible role in insulin resistance. Science. 2003;300:1140–1142. - PMC - PubMed

Publication types

MeSH terms