. 2008 Jun 26;27(28):3944-56.
doi: 10.1038/onc.2008.19. Epub 2008 Feb 25.

Mechanisms of acquired resistance to cetuximab: role of HER (ErbB) family members

Affiliations

Mechanisms of acquired resistance to cetuximab: role of HER (ErbB) family members

D L Wheeler et al. Oncogene. .

Abstract

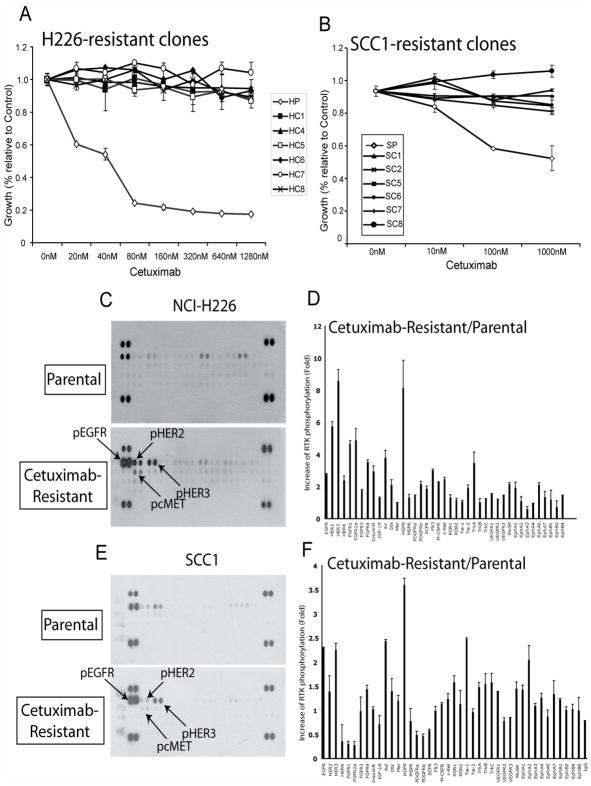
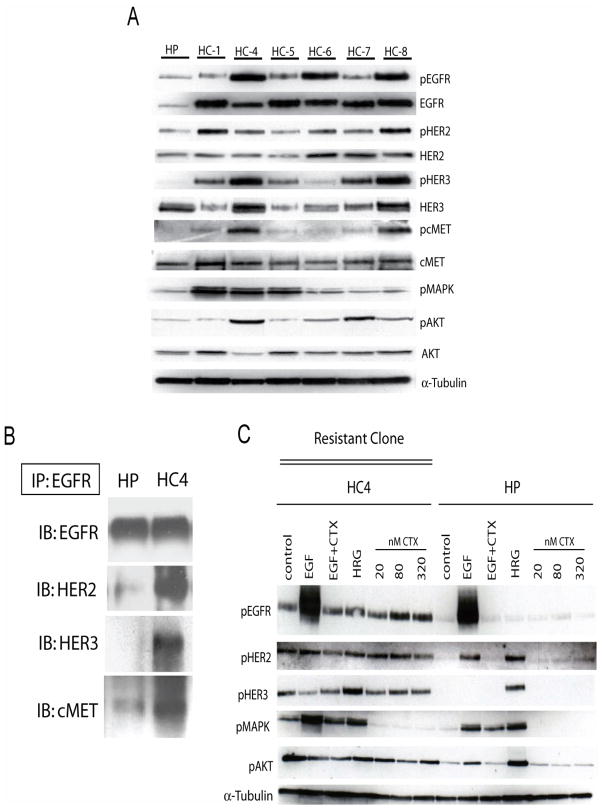
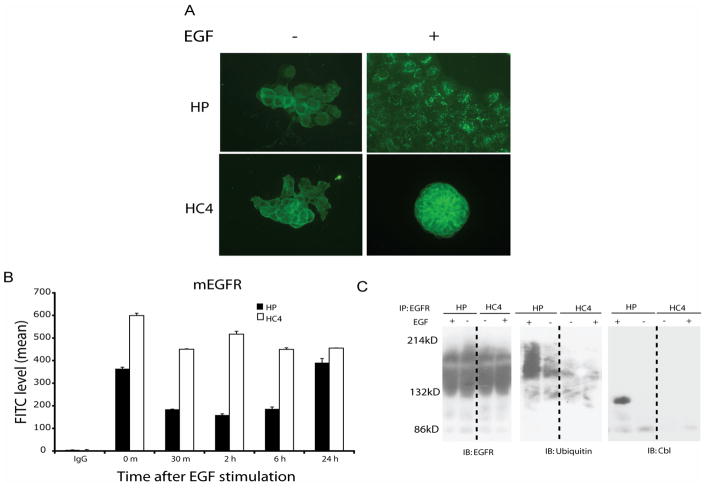
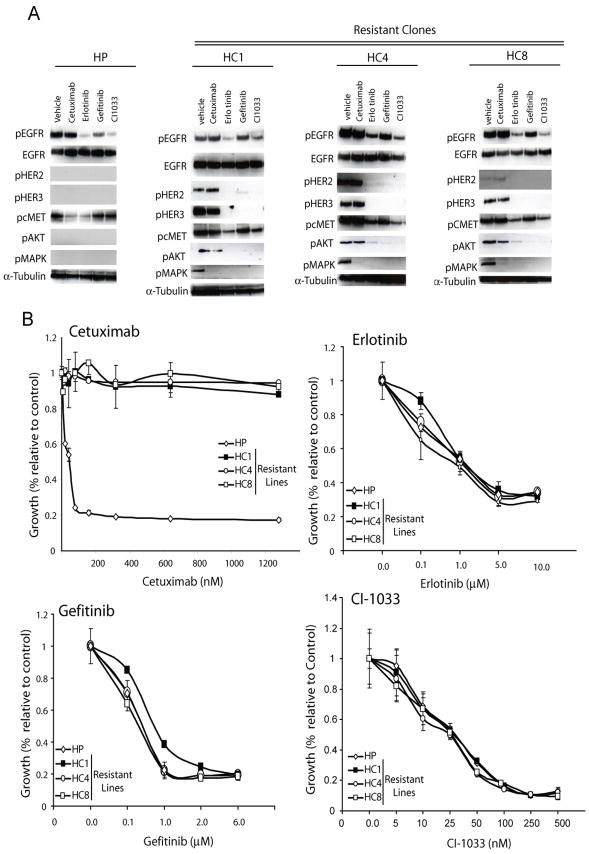
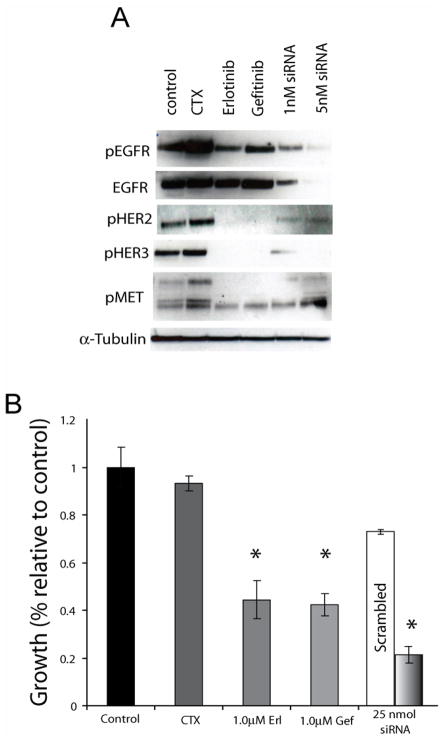
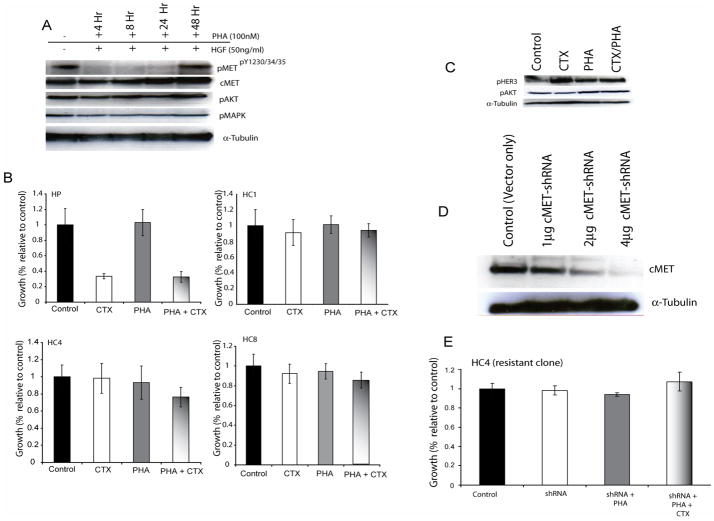
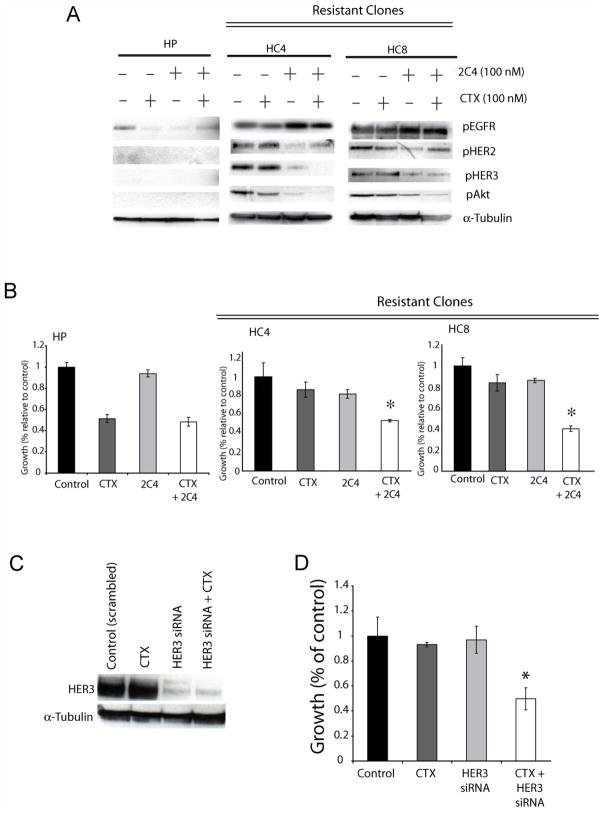
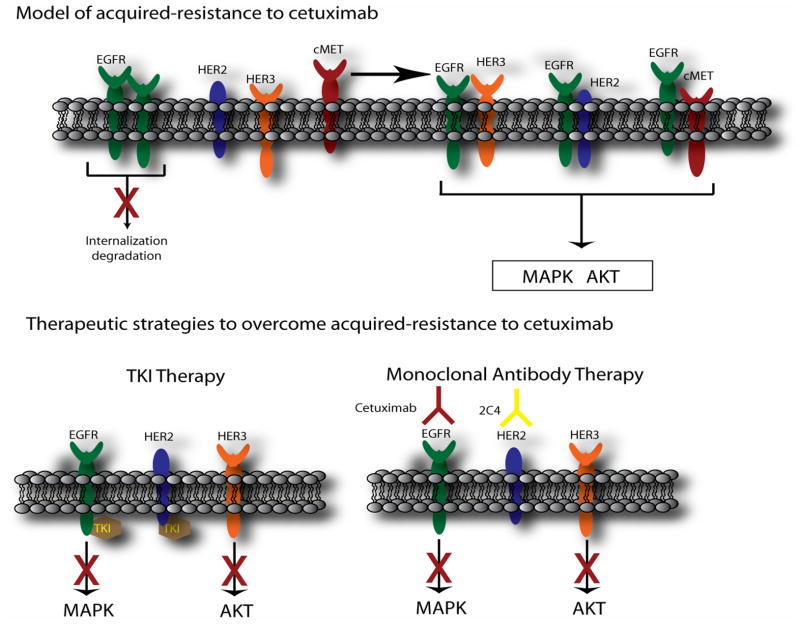
The epidermal growth factor receptor (EGFR) is a central regulator of proliferation and progression in human cancers. Five EGFR inhibitors, two monoclonal antibodies and three TKIs, have recently gained FDA approval in oncology (cetuximab, panitumumab, erlotinib, gefitinib and lapatinib). These strategies of EGFR inhibition demonstrate major tumor regressions in approximately 10-20% of advanced cancer patients. However, many tumors eventually manifest acquired resistance to treatment. In this study we established and characterized a model to study molecular mechanisms of acquired resistance to the EGFR monoclonal antibody cetuximab. Using high-throughput screening we examined the activity of 42 receptor tyrosine kinases in resistant tumor cells following chronic exposure to cetuximab. Cells developing acquired resistance to cetuximab exhibited increased steady-state EGFR expression secondary to alterations in trafficking and degradation. In addition, cetuximab-resistant cells manifested strong activation of HER2, HER3 and cMET. EGFR upregulation promoted increased dimerization with HER2 and HER3 leading to their transactivation. Blockade of EGFR and HER2 led to loss of HER3 and PI(3)K/Akt activity. These data suggest that acquired resistance to cetuximab is accompanied by dysregulation of EGFR internalization/degradation and subsequent EGFR-dependent activation of HER3. Taken together these findings suggest a rationale for the clinical evaluation of combinatorial anti-HER targeting approaches in tumors manifesting acquired resistance to cetuximab.


Figures

Figure 1
Figure 1. phospho-receptor tyrosine kinase (RTK) array in NSCLC H226 and HNSCC SCC1 cells demonstrate upregulation of EGFR, HER2, HER3 and cMET
A: Cetuximab dose response curve using NSCLC line NCI-H226 cetuximab-resistant clones. Cells were treated with the indicated concentration of cetuximab and growth was measured using the growth proliferation assay as described in the experimental procedures and plotted as a percentage of growth relative to the untreated control cells. Data points are represented as mean ±SEM (n=3). B: Cetuximab dose response curve using HNSCC line SCC-1 cetuximab-resistant clones. Cells were treated with the indicated concentration of cetuximab and growth was measured using the growth proliferation assay as described in the experimental procedures and plotted as a percentage of growth relative to the untreated control cells. Data points are represented as mean ±SEM (n=3). C-F: HER family members have increased activity in HNSCC and NSCLC cetuximab-resistant cells. Cetuximab-sensitive (Parental) and cetuximab-resistant cells were grown to confluence followed by protein extraction. The cell extracts were incubated with membranes containing antibodies to 42 different RTKs. The membranes were washed and incubated with a pan anti-phosphotyrosine antibody to measure the levels of active receptor. Quantitation of phospho-RTK was completed using scanned images from ImageQuant software. Data points are represented as mean ±SEM (n=3).
Figure 2
Figure 2. EGFR is upregulated in cetuximab-resistant cells
A: Characterization of expression of HER family members and down stream Akt and MAPK in cetuximab-resistant clones (HC1, HC4-HC8). Protein was collected and fractionated by SDS-PAGE followed by immunoblotting for the indicated proteins. α-tubulin was used as loading control. HP; cetuximab-sensitive parental line, HC; cetuximab-resistant clones. B: EGFR has increased association with HER2, HER3, and cMET in cetuximab-resistant cells. Cetuximab-resistant cells were harvested and EGFR was immunoprecipitated from the cetuximab-resistant clone HC4 and the parental HP cells with an anti-EGFR antibody. The immunoprecipitates were fractionated on SDS-PAGE followed by immunoblotting for the indicated proteins. HP; cetuximab-sensitive parental line, HC4; cetuximab-resistant clone. C: Cetuximab treatment does not modulate EGFR phosphorylation in cetuximab-resistant clone (HC4). Parental cells (HP) and cetuximab-resistant clone (HC4) were treated with vehicle (control) or increasing concentrations of cetuximab (CTX) for 24 hours. Stimulation was with EGF (10ng/ml) and HRG (5μM) for 45 minutes. Protein was collected and fractionated by SDS-PAGE followed by immunoblotting for the indicated proteins. α-tubulin was used as a loading control.
Figure 3
Figure 3. Cetuximab-resistant cells have increased EGFR plasma membrane expression
A: EGFR is internalized following EGF stimulation in parental (HP), but not in cetuximab-resistant cells (HC4). Internalization of EGFR was determined by immunofluorescent staining as described in “Experimental Procedures” using FITC-conjugated anti-EGFR antibody 45 min following EGF (25 ng/ml) stimulation. Internalized EGFR was indicated by the accumulation of intracellular endocytic vesicles staining for EGFR. B: Cell surface EGFR is decreased following EGF stimulation in parental (HP), but not in cetuximab-resistant cells (HC4) The levels of EGFR on the cell surface were monitored following 0~24 hr of EGF (25 ng/ml) stimulation by flow cytometry as described in “Experimental Procedures”. The numbers represent mean fluorescence intensity of anti-EGFR staining after subtracting IgG background fluorescence. C: Lack of c-Cbl recruitment and EGFR ubiquitination in cetuximab-resistant cells following EGF stimulation. Cetuximab-resistant (HC4) and parental (HP) cells were either untreated (-) or treated with EGF (25 ng/ml) for 45 min. Thereafter, cell lysates were prepared and analyzed by immunoprecipitation (IP) and immunoblotting (IB) with the indicated antibodies.
Figure 4
Figure 4. TKIs retain capacity to inhibit HER signaling in cetuximab-resistant clones
A: HER family members and downstream signaling molecules are attenuated after treatment with TKIs in cetuximab-resistant clones. Parental cells (HP) and cetuximab-resistant clones (HC1, HC4 and HC8) were treated with vehicle (DMSO), cetuximab (100nM), erlotinib (10uM), gefitinib (1uM) or CI-1033(500nM) for 24 hours. Protein lysates were fractionated on SDS-PAGE followed by Western blotting the indicated proteins. α-Tubulin was used as a loading control. B: TKIs inhibit proliferation in cetuximab-resistant clones Parental cells (HP) and cetuximab-resistant clones (HC1, HC4, HC8) were plated and allowed to adhere overnight. Growth was measured at 72 hours after drug treatment using the growth proliferation assay as described in the experimental procedures and plotted as a percentage of growth relative to the untreated control cells. Treatment groups were cetuximab, erlotinib, gefitinib, CI-1033. Data points are represented as mean ±SEM (n=6).
Figure 5
Figure 5. HER2 and HER3 activity in cetuximab-resistant cells is EGFR-dependent
A: Effects of EGFR knockdown on HER2 and HER3 activity. HC4 cells were plated and treated with the vehicle DMSO (control), 1μM erlotinib, 1μM gefitinib, 1nM of EGFR siRNA, 1 or 5 nM EGFR siRNA. 48 hours later protein was colleted and fractionated by SDS-PAGE and immunoblotted for the indicated proteins. B: Effects of EGFR knockdown on proliferation of cetuximab-resistant cells. Cetuximab-resistant clone HC4 was plated and treated with control (DMSO), 100nM cetuximab, 1 μM erlotinib, 1 μM gefitinib, or 25 nM of EGFR siRNA. 72 hours later growth proliferation was measured as outlined in the materials and methods. *, P<0.05
Figure 6
Figure 6. Inhibition of cMET activity does not re-sensitize cetuximab-resistant cells to cetuximab
A: PHA665752 inhibits cMET activity without affecting Akt or MAPK signaling. Cetuximab-resistant clone HC4 was treated with PHA665752 for 4, 8, 24 or 48 hour. Cells were then stimulated with HGF for 45 minutes. Western blot shows inhibition of cMET activity up to 24 hours when treated with PHA665752. B: PHA665752 alone or in combination with cetuximab does not inhibit growth of cetuximab- resistant cells. Growth was measured at 72 hours after drug treatment using the growth proliferation assay as described in the experimental procedures and plotted as a percentage of growth relative to the untreated control cells. Treatment groups were cetuximab (CTX), PHA665752 (PHA) or the combination of the two drugs. HP; cetuximab-sensitive parental line, HC; cetuximab-resistant clones. Data points are represented as mean ±SEM (n=3). C: Western blotting of cetuximab-resistant clone (HC4) cells after treatment with cetuximab, PHA665752 or the combination. Cetuximab-resistant clone HC4 was treated with cetuximab (100nM), PHA665752 (100nM) or the combination. 24 hours later protein was collected and fractionated by SDS-PAGE and immunoblotted for the indicated proteins. D: Western blotting of cetuximab-resistant clone (HC4) cells after transient transfection with cMET shRNA vectors. Control is empty vector control. 1, 2, and 4 micrograms of vector were transfected. Cells were collected 48 hours after treatment. 48 hours after transfection protein was collected and fractionated by SDS-PAGE and immunoblotted for the indicated proteins. E: Loss of cMET does not affect growth of cetuximab-resistant cells (HC4). Cells were transfected with cMET shRNA vectors followed by treatment with vehicle (shRNA only), PHA665752 (shRNA+PHA group) or PHA665752 or cetuximab (shRNA+PHA+CTX group). Growth was measured at 72 hours after treatment using the growth proliferation assay as described in the experimental procedures and plotted as a percentage of growth relative to the untreated control cells. Data points are represented as mean ±SEM (n=6).
Figure 7
Figure 7. Inhibition of HER2 or HER3 activity sensitizes cetuximab-resistant cells
A: Combinatorial treatment of cetuximab-resistant clones HC4 and HC8 with cetuximab and 2C4 leads to loss of HER3 and AKT activity. Parental cells (HP) and cetuximab-resistant clones HC4 and HC8 were treated with cetuximab (CTX), 2C4 (2C4) or the combination. Protein lysates were fractionated on SDS-PAGE followed by Western blotting for the indicated proteins. α-Tubulin was used as a loading control. B: Combinatorial treatment of cetuximab-resistant clones with cetuximab and 2C4 leads to growth inhibition. Parental cells (HP) and cetuximab-resistant clones (HC4, HC8) were plated and allowed to adhere overnight. Growth was measured at 72 hours after drug treatment using the growth proliferation assay as described in the experimental procedures and plotted as a percentage of growth relative to the untreated control cells. Treatment groups were cetuximab (100nM), 2C4 (100nM) or the combination. Data points are represented as mean ±SEM (n=6). *, P<0.05 C: Western blotting of cetuximab-resistant clone (HC4) cells after transient transfection with HER3 siRNA. Treatments are: Scrambled siRNA (50nM), Cetuximab (100nM), HER3 siRNA (50nM) or the combination. 48 hours after treatment protein was collected and fractionated by SDS-PAGE and immunoblotted for the indicated proteins. D: HER3 knockdown re-sensitizes cetuximab-resistant cells to cetuximab. Cells were transfected with scrambled (50nM, control), 100nM cetuximab, HER3 (50nM) siRNA in combination with 100nM cetuximab. The cells were collected 48 hours later for Western blot analysis of the indicated proteins. Growth was measured at 72 hours after treatment using the growth proliferation assay as described in the experimental procedures and plotted as a percentage of growth relative to the untreated control cells. Data points are represented as mean ±SEM (n=6). *, P<0.05
Figure 8
Figure 8. Model of acquired-resistance to cetuximab and therapeutic strategies to overcome resistance
Chronic exposure to cetuximab leads to dysregulation of c-Cbl mediated internalization and degradation of the EGFR. This increased steady-state expression of EGFR serves to bind and activate HER2 or HER3 and thereby maintain signaling to MAPK and Akt pathways in the presence of cetuximab. TKIs targeting EGFR and HER2 lead to blockade of HER3 transactivation and subsequent pro-survival signals to Akt. In addition, combinatorial monoclonal antibody therapy using cetuximab and 2C4 leads to inactivation of HER3 and down regulation of its signaling pathways.

References

    1. Baselga J, Arteaga CL. Critical update and emerging trends in epidermal growth factor receptor targeting in cancer. J Clin Oncol. 2005;23:2445–59. - PubMed
    1. Benavente S, Huang S, Armstrong E, Chi A, Chinnaiyan P, Harari PM. Establishment of acquired resistance to epidermal growth factor receptor (EGFR) inhibitors in human tumor cell lines. AACR Meeting Abstracts. 2004:1230-a.
    1. Bonner JA, Harari PM, Giralt J, Azarnia N, Shin DM, Cohen RB, et al. Radiotherapy plus cetuximab for squamous-cell carcinoma of the head and neck. N Engl J Med. 2006;354:567–78. - PubMed
    1. Christensen JG, Schreck R, Burrows J, Kuruganti P, Chan E, Le P, et al. A selective small molecule inhibitor of c-Met kinase inhibits c-Met-dependent phenotypes in vitro and exhibits cytoreductive antitumor activity in vivo. Cancer Res. 2003;63:7345–55. - PubMed
    1. Ciardiello F, Bianco R, Caputo R, Caputo R, Damiano V, Troiani T, et al. Antitumor activity of ZD6474, a vascular endothelial growth factor receptor tyrosine kinase inhibitor, in human cancer cells with acquired resistance to antiepidermal growth factor receptor therapy. Clin Cancer Res. 2004;10:784–93. - PubMed

Publication types