. 2008 Feb 20;3(2):e1611.
doi: 10.1371/journal.pone.0001611.

Gene expression profiling of a mouse model of pancreatic islet dysmorphogenesis

Affiliations

Gene expression profiling of a mouse model of pancreatic islet dysmorphogenesis

Laura Wilding Crawford et al. PLoS One. .

Abstract

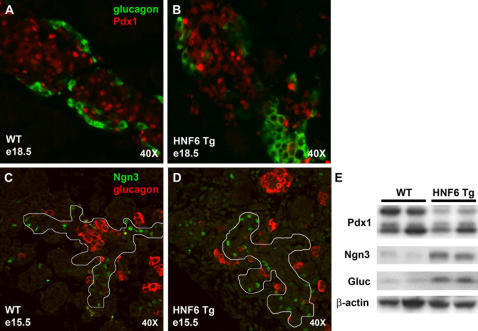
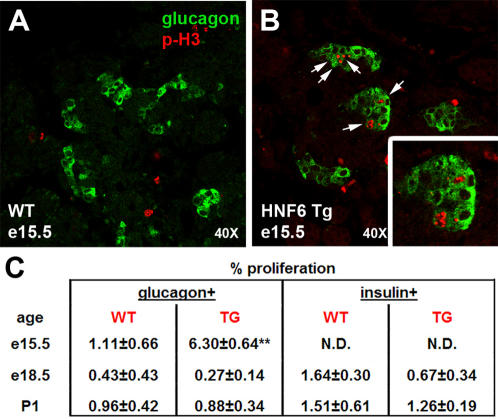
Background: In the past decade, several transcription factors critical for pancreas organogenesis have been identified. Despite this success, many of the factors necessary for proper islet morphogenesis and function remain uncharacterized. Previous studies have shown that transgenic over-expression of the transcription factor Hnf6 specifically in the pancreatic endocrine cell lineage resulted in disruptions in islet morphogenesis, including dysfunctional endocrine cell sorting, increased individual islet size, increased number of peripheral endocrine cell types, and failure of islets to migrate away from the ductal epithelium. The mechanisms whereby maintained Hnf6 causes defects in islet morphogenesis have yet to be elucidated.

Methodology/principal findings: We exploited the dysmorphic islets in Hnf6 transgenic animals as a tool to identify factors important for islet morphogenesis. Genome-wide microarray analysis was used to identify differences in the gene expression profiles of late gestation and early postnatal total pancreas tissue from wild type and Hnf6 transgenic animals. Here we report the identification of genes with an altered expression in Hnf6 transgenic animals and highlight factors with potential importance in islet morphogenesis. Importantly, gene products involved in cell adhesion, cell migration, ECM remodeling and proliferation were found to be altered in Hnf6 transgenic pancreata, revealing specific candidates that can now be analyzed directly for their role in these processes during islet development.

Conclusions/significance: This study provides a unique dataset that can act as a starting point for other investigators to explore the role of the identified genes in pancreatogenesis, islet morphogenesis and mature beta cell function.


Conflict of interest statement

Competing Interests: The authors have declared that no competing interests exist.

Figures

Figure 1
Figure 1. Hnf6 Tg animals exhibit abnormal islet morphogenesis.
(A) Islet from a four week old WT animal showing insulin-producing β cells at the islet core (green) and glucagon-producing α cells at the periphery (red). (B) At the same age, individual Hnf6 Tg islets are larger, have a mixed islet phenotype, and are closely apposed to the ductal epithelium. (A*, B*) At e18.5, WT endocrine cells have begun to adopt the stereotypic architecture; however, Hnf6 Tg α cells are often clustered together in islet-like structures that have few, if any, β cells (arrows in B*). (C) Morphometric analysis demonstrates increased glucagon+ cell area (red) as early as e15.5 in Hnf6 Tg islets (dark red). This relative increase over WT islets (solid bars) persists into postnatal stages. Total insulin+ area decreases in transgenic animals (dark green) at postnatal stages, but does not appear to be altered during embryogenesis. e15.5, n = 4; e18.5, n = 4; P1, n = 2; 2 weeks, n = 3. Error bars were determined by 95% confidence interval. *p<0.05, **p<0.005, as determined by Student's t-test. d, duct; bv, blood vessel.
Figure 2
Figure 2. Assessment of replicate consistency and gene expression changes.
Each line on the graph represents an individual spot on the array. Normalized ratio values of the average for the three WT samples (WT1-WT3) were plotted against each individual WT sample (left) and each individual Hnf6 Tg sample (right; Tg1-Tg3). Ratio values indicating no change in gene expression are seen in yellow at a value of 1.0. Transcripts that have an altered expression in Hnf6 Tg animals compared to WT animals are indicated in shades of red (greater than 1.0) or blue (less than 1.0).
Figure 3
Figure 3. RT-PCR validation of microarray results.
P1 pancreatic WT (blue) and Hnf6 Tg (purple) RNA was analyzed for the expression of the transcripts indicated. Values are expressed in arbitrary units as a ratio (transcript:tubulin) of the average of individual samples for each genotype. Error bars represent SEM; *p<0.05. n.d., not detectable. For comparison, microarray analysis of these same transcripts revealed the following: OC-1 increased two-fold; Pdx1 no change; Nnat decreased two-fold; Reg2 increased 1.7-fold; Ectodin increased 1.6- to 1.9-fold; Serpina6 increased 4.6-fold; PERK decreased two-fold.
Figure 4
Figure 4. Relative proportion of transcripts altered in Hnf6 Tg animals as determined by gene ontology analysis.
Known transcripts altered by 1.5-fold or greater were placed into one of 16 categories, represented by specific colors on each chart. (A) Transcripts up-regulated at e18.5 (total 582). (B) Transcripts down-regulated at e18.5 (total 283). (C) Transcripts up-regulated at P1 (total 135). (D) Transcripts down-regulated at P1 (total 161).
Figure 5
Figure 5. Immunofluorescent and western blot validation of microarray results for Hnf6 transcriptional targets.
No changes in Pdx1 expression (red) were observed by co-immunohistochemistry in e18.5 WT (A) and Hnf6 Tg (B) embryonic pancreata (glucagon shown in green). In contrast, Increased numbers of Ngn3+ cells (green) were observed within the pancreatic epithelium (outlined) at e15.5 (glucagon+ cells shown in red) in HNF6 Tg pancreata (C) as compared to WT pancreata (D). P1 pancreatic extracts (E) were probed for the expression of the proteins indicated. Values are expressed as a ratio (WT:Hnf6 Tg). Two representative samples for each genotype are shown.
Figure 6
Figure 6. Increased proliferation of glucagon+ cells in Hnf6 Tg pancreata.
Proliferation rates in WT (A) versus Hnf6 Tg (B) pancreata were determined by co-immunohistochemistry for phosphorylated histone H3 (p-H3, red) and either glucagon (green) or insulin (data not shown). (C) Number of cells that co-expressed p-H3 and either glucagon or insulin are expressed as a percentage of the total hormone+ cells counted at e15.5, e18.5, and P1; **p = 0.004.

References

    1. Ryan EA, Paty BW, Senior PA, Bigam D, Alfadhli E, et al. Five-year follow-up after clinical islet transplantation. Diabetes. 2005;54:2060–2069. - PubMed
    1. Jensen J. Gene regulatory factors in pancreatic development. Dev Dyn. 2004;229:176–200. - PubMed
    1. Apelqvist A, Li H, Sommer L, Beatus P, Anderson DJ, et al. Notch signalling controls pancreatic cell differentiation. Nature. 1999;400:877–881. - PubMed
    1. Murtaugh LC, Stanger BZ, Kwan KM, Melton DA. Notch signaling controls multiple steps of pancreatic differentiation. Proc Natl Acad Sci U S A. 2003;100:14920–14925. Epub 12003 Dec 14921. - PMC - PubMed
    1. Hart A, Papadopoulou S, Edlund H. Fgf10 maintains notch activation, stimulates proliferation, and blocks differentiation of pancreatic epithelial cells. Dev Dyn. 2003;228:185–193. - PubMed

Publication types

Substances