

Effects of dependence in high-dimensional multiple testing problems
- PMID: 18298808
- PMCID: PMC2375137
- DOI: 10.1186/1471-2105-9-114
Effects of dependence in high-dimensional multiple testing problems
Abstract
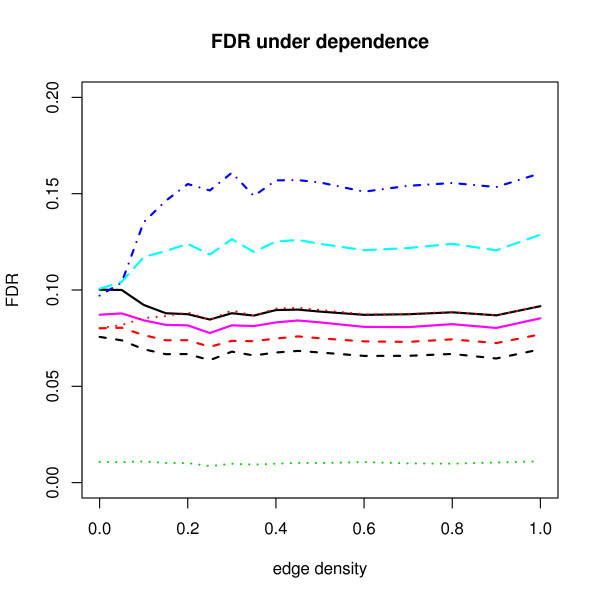
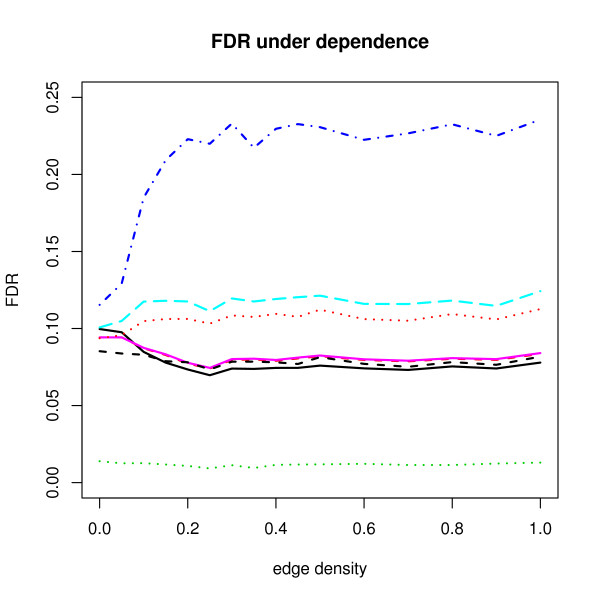
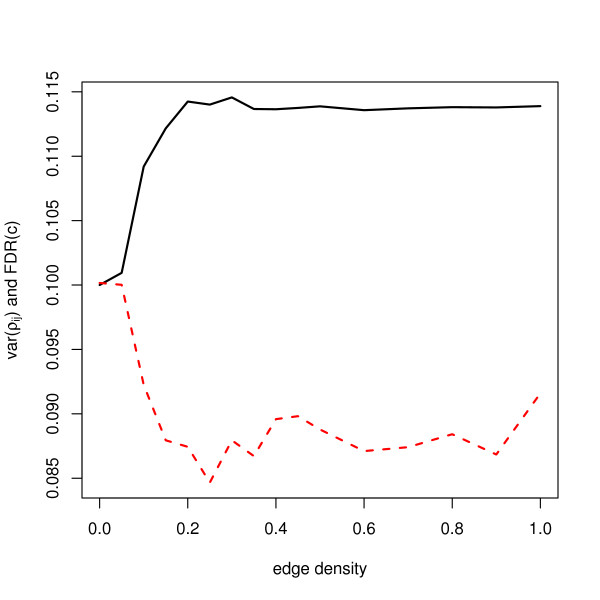
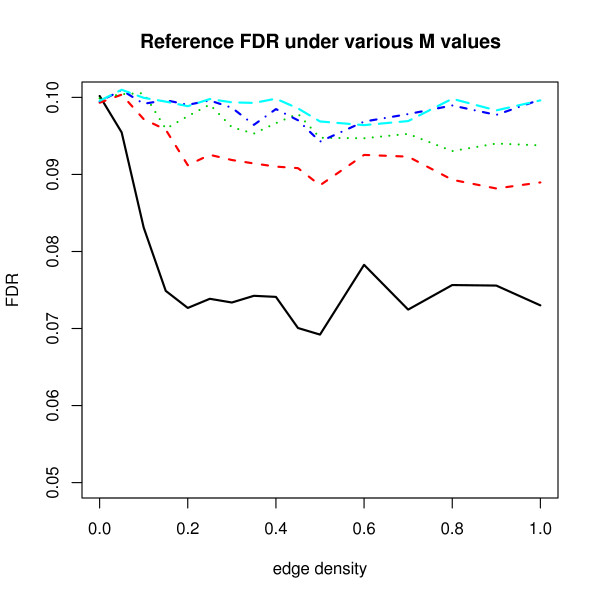
Background: We consider effects of dependence among variables of high-dimensional data in multiple hypothesis testing problems, in particular the False Discovery Rate (FDR) control procedures. Recent simulation studies consider only simple correlation structures among variables, which is hardly inspired by real data features. Our aim is to systematically study effects of several network features like sparsity and correlation strength by imposing dependence structures among variables using random correlation matrices.
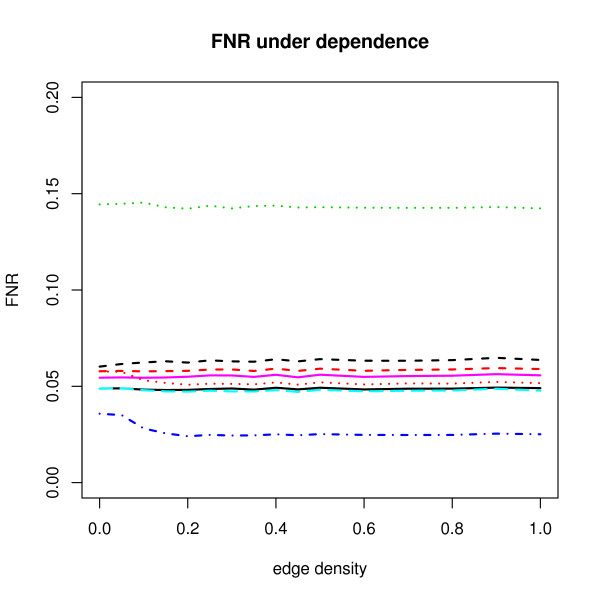
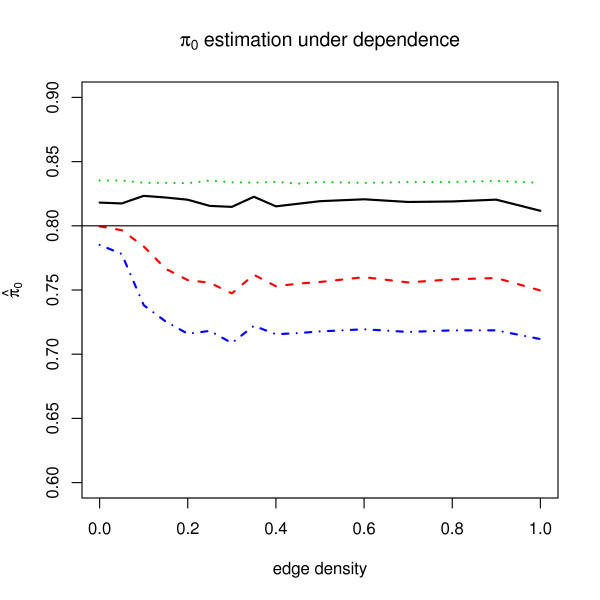
Results: We study the robustness against dependence of several FDR procedures that are popular in microarray studies, such as Benjamin-Hochberg FDR, Storey's q-value, SAM and resampling based FDR procedures. False Non-discovery Rates and estimates of the number of null hypotheses are computed from those methods and compared. Our simulation study shows that methods such as SAM and the q-value do not adequately control the FDR to the level claimed under dependence conditions. On the other hand, the adaptive Benjamini-Hochberg procedure seems to be most robust while remaining conservative. Finally, the estimates of the number of true null hypotheses under various dependence conditions are variable.
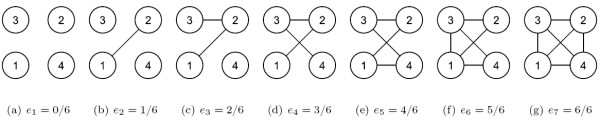
Conclusion: We discuss a new method for efficient guided simulation of dependent data, which satisfy imposed network constraints as conditional independence structures. Our simulation set-up allows for a structural study of the effect of dependencies on multiple testing criterions and is useful for testing a potentially new method on pi0 or FDR estimation in a dependency context.
Figures
References
-
- Wille A, Zimmermann P, Vranova E, Furholz A, Laule O, Bleuler S, Hennig L, Prelic A, von Rohr P, Thiele L, Zitzler E, Gruissem W, Buhlmann P. Sparse graphical Gaussian modeling of the isoprenoid gene network in Arabidopsis thaliana. Genome Biol. 2004;5:R92. doi: 10.1186/gb-2004-5-11-r92. - DOI - PMC - PubMed
-
- Benjamini Y, Hochberg Y. Controlling the false discovery rate: a practical and powerful approach to multiple testing. J Roy Statist Soc Ser B. 1995;57:289–300.
-
- Benjamini Y, Yekutieli D. The control of the false discovery rate in multiple testing under dependency. Ann Statist. 2001;29:1165–1188. doi: 10.1214/aos/1013699998. - DOI
-
- Storey JD. The positive false discovery rate: a Bayesian interpretation and the q -value. Ann Statist. 2003;31:2013–2035. doi: 10.1214/aos/1074290335. - DOI
-
- Storey J, Tibshirani R. Tech Rep 2001–12. Stanford University; 2001. Estimating false discovery rates under dependence, with applications to DNA microarrays.http://www-stat.stanford.edu/reports/papers2001.html
Publication types
MeSH terms
LinkOut - more resources
Full Text Sources
