. 2008 Feb 25;180(4):803-12.
doi: 10.1083/jcb.200708109.

Integration of Golgi trafficking and growth factor signaling by the lipid phosphatase SAC1

Affiliations

Integration of Golgi trafficking and growth factor signaling by the lipid phosphatase SAC1

Anastasia Blagoveshchenskaya et al. J Cell Biol. .

Abstract

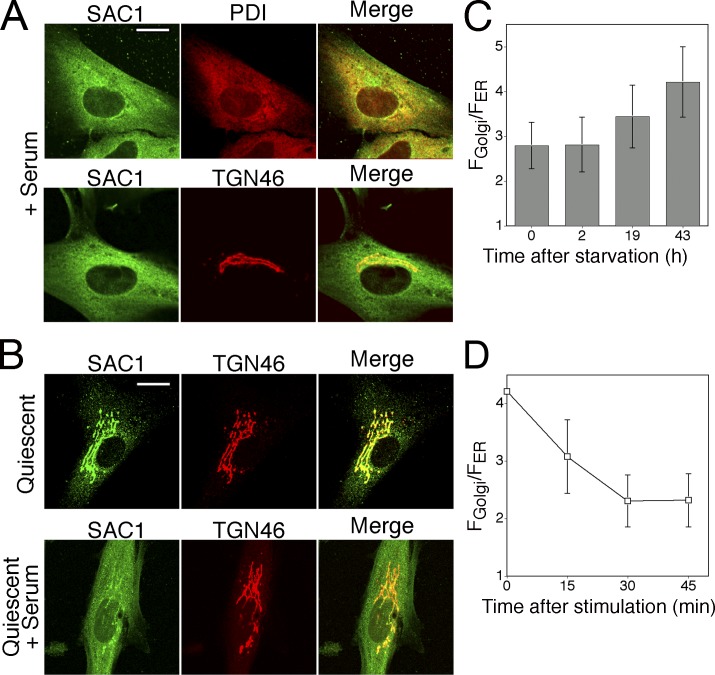
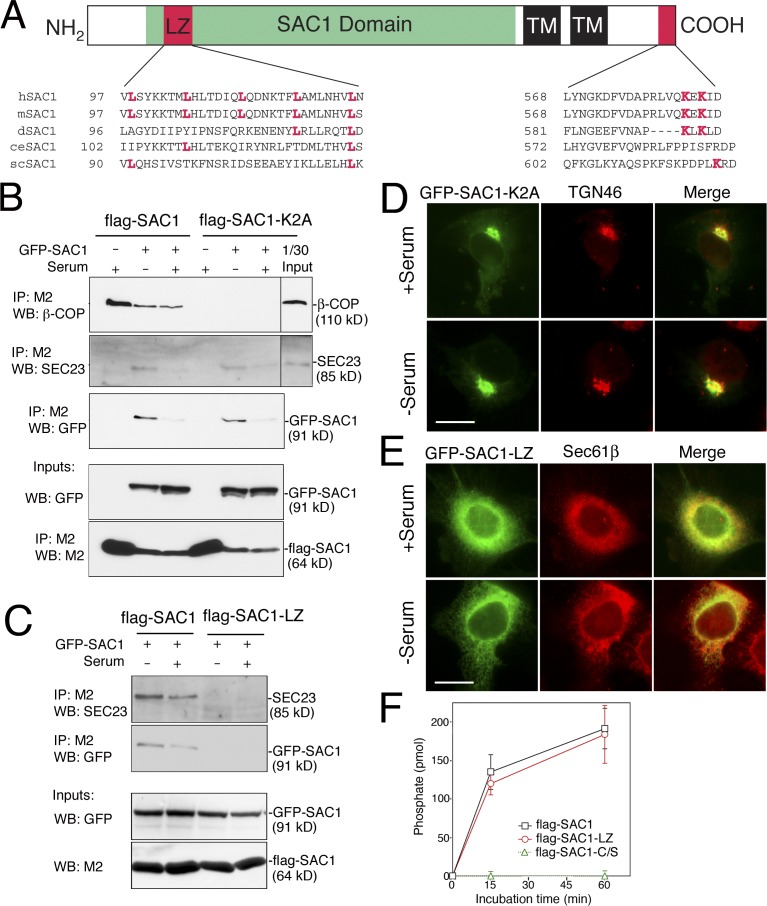
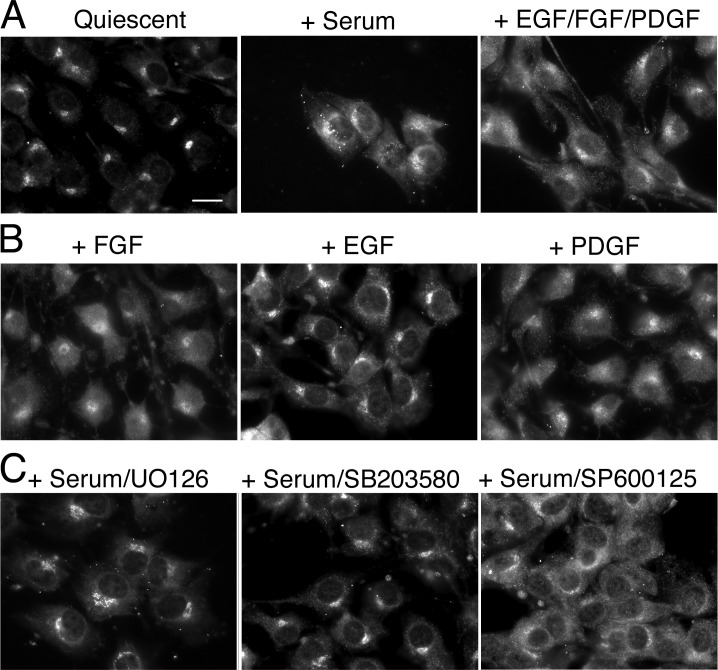
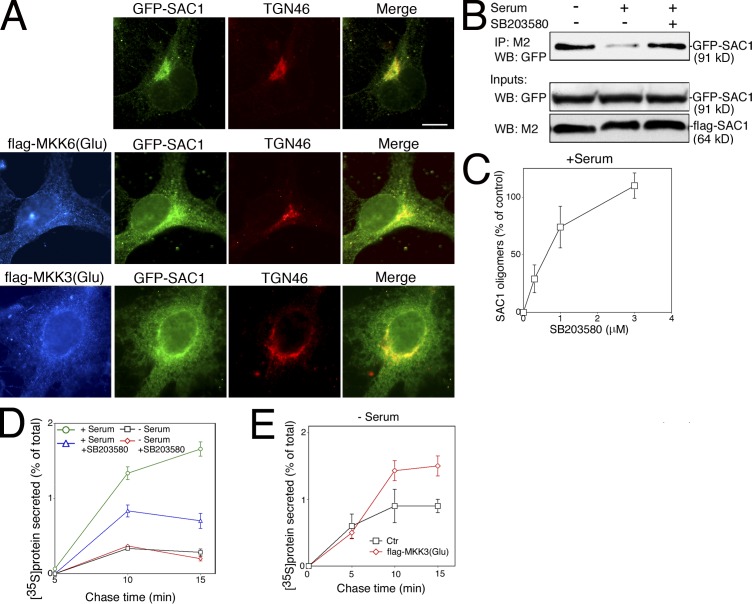
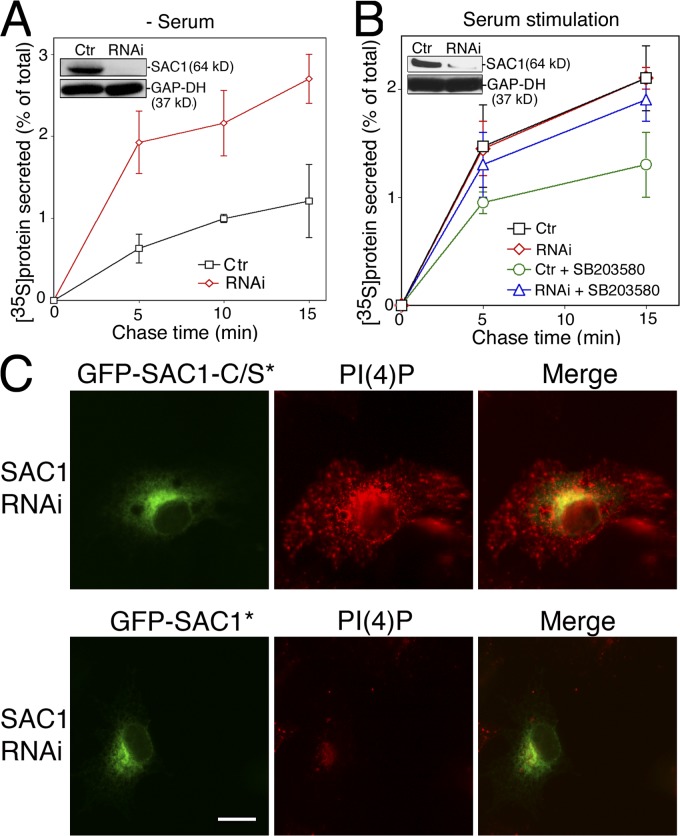
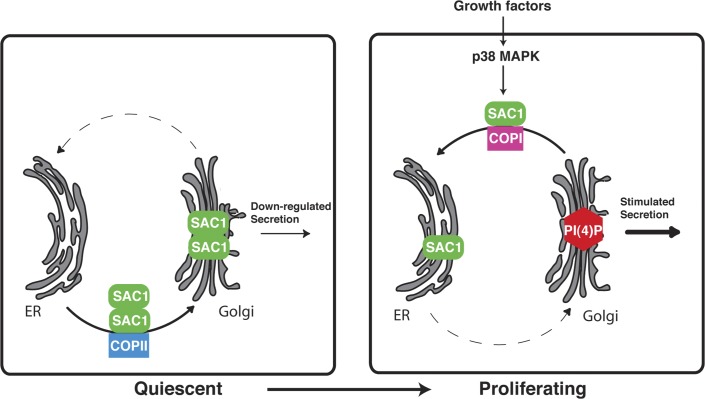
When a growing cell expands, lipids and proteins must be delivered to its periphery. Although this phenomenon has been observed for decades, it remains unknown how the secretory pathway responds to growth signaling. We demonstrate that control of Golgi phosphatidylinositol-4-phosphate (PI(4)P) is required for growth-dependent secretion. The phosphoinositide phosphatase SAC1 accumulates at the Golgi in quiescent cells and down-regulates anterograde trafficking by depleting Golgi PI(4)P. Golgi localization requires oligomerization of SAC1 and recruitment of the coat protein (COP) II complex. When quiescent cells are stimulated by mitogens, SAC1 rapidly shuttles back to the endoplasmic reticulum (ER), thus releasing the brake on Golgi secretion. The p38 mitogen-activated kinase (MAPK) pathway induces dissociation of SAC1 oligomers after mitogen stimulation, which triggers COP-I-mediated retrieval of SAC1 to the ER. Inhibition of p38 MAPK abolishes growth factor-induced Golgi-to-ER shuttling of SAC1 and slows secretion. These results suggest direct roles for p38 MAPK and SAC1 in transmitting growth signals to the secretory machinery.


Figures

Figure 1.
Figure 1.
Growth-dependent localization of SAC1 in fibroblasts. (A) Confocal immunofluorescence microscopy of human fibroblasts grown in the presence of 15% FCS. The cells were fixed, permeabilized, and costained with polyclonal anti-SAC1 (green) and monoclonal anti-PDI or anti-TGN46 antibodies (red). Bar, 15 μm. (B) Human fibroblasts were cultivated for 24 h in the presence of 0.5% FCS to induce quiescence. The quiescent cells were subsequently stimulated with 15% FCS for another 24 h. Cells were processed for confocal immunofluorescence microscopy as in A. Bar, 15 μm. (C) NIH3T3 cells were grown in 10% NBS and then starved in the presence of 0.5% serum for the indicated times. SAC1 was visualized by immunofluorescence microscopy. The ratio of mean fluorescence intensity in Golgi regions (FGolgi) to the mean fluorescence intensity in ER structures (FER) was calculated at different time points and used as a measure of SAC1 distribution. Values are means ± SD from individual cells (n = 7–12). (D) NIH3T3 cells were starved in 0.5% serum for 48 h and then stimulated with 10% serum. SAC1 was visualized by immunofluorescence analysis. The ratio between mean fluorescence intensity in the Golgi regions (FGolgi) and mean fluorescence intensity in ER-structures (FER) was calculated at different time points and used as a measure of SAC1 distribution. Values are means ± SD from individual cells (n = 10–15).
Figure 2.
Figure 2.
Growth-dependent oligomerization of SAC1 regulates its ER–Golgi distribution. (A) Sequence motifs in SAC1 orthologues. Leucine residues within the putative LZ motif and lysine residues within the C-terminal ER retrieval motif are highlighted in magenta. (B and C) COS7 cells transiently expressing flag-SAC1 mutants and/or GFP-SAC1 were cultured either in the presence (10%) or absence (0.5%) of serum for 24 h and lysed, and flag-SAC1 was immunoprecipitated with M2 agarose beads. The bound proteins were separated by SDS-PAGE and analyzed by immunoblotting with anti-GFP, β-COP, or SEC23 antibodies. Black lines indicate that intervening lanes have been spliced out. (D and E) COS7 cells transiently expressing GFP-SAC1-K2A (D, green) or GFP-SAC1-LZ (E, green) were cultured either in the presence (10%) or absence (0.5%) of serum for 24 h and then subjected to immunofluorescence microscopy using either polyclonal anti-TGN46 (D, red) or anti-Sec61β (E, red). Bars, 15 μm. (F) COS7 cells were infected with adenoviruses to express flag-tagged versions of SAC1, SAC1-LZ, and phosphatase-dead SAC1-C/S. Cells were then lysed and SAC1 was collected on M2 agarose beads. After the elution with 200 μg/ml of M2 peptide, 2 μg of each purified SAC1 protein was assayed for phosphatase activity using dioctanoyl-PI(4)P as a substrate. Data are from three independent phosphatase measurements. Data represent means ± SD from three independent experiments.
Figure 3.
Figure 3.
Role for MAPKs in growth-dependent SAC1 translocation to the ER. (A–C) Localization of the endogenous SAC1 in NIH3T3 cells was analyzed by immunofluorescence microscopy using polyclonal anti-SAC1 antibodies. Quiescent cells were stimulated by the addition of 10% serum (C) or a mix of EGF/basic FGF/PDGF (A) or individual growth factors (B) for 1 h at 37°C. (C) Quiescent cells were incubated with 10 μM of the MEK1/2 inhibitor UO126, 10 μM of the JNK MAPK inhibitor SP600125, or 10 μM p38 MAPK before stimulation with 10% serum. Bar, 15 μm.
Figure 4.
Figure 4.
Effect of p38 MAPK on SAC1 oligomerization and constitutive secretion. (A) Expression of constitutively active alleles of MKK3 and 6 induces ER localization of SAC1 in serum-starved cells. COS7 cells were transfected with plasmids for expressing GFP-SAC1 (green) and flag-MKK6(Glu) (blue) or flag-MKK3(Glu) (blue). Cells were fixed, permeabilized, and costained with M2 antibodies (blue) and polyconal anti-TGN46 (red). Merged images show colocalization of GFP-SAC1 (green) and TGN46 (red). Bar, 15 μm. (B) COS7 cells transiently expressing flag-SAC1 and GFP-SAC1 were starved in the presence of 0.5% serum for 24 h and then stimulated with 10% serum with or without 10 μM SB203580. Cells were lysed and flag-SAC1 was immunoprecipitated with M2 agarose beads. Proteins were separated by SDS-PAGE followed by immunoblotting with anti-GFP or M2 antibodies. (C) COS7 cells transiently expressing flag-SAC1 and GFP-SAC1 were starved in the presence of 0.5% serum for 24 h and then stimulated with 10% serum in the presence of increasing concentrations of SB503280 (0.3–3 μM). Cells were lysed and flag-SAC1 was immunoprecipitated with M2 agarose beads. Proteins were separated by SDS-PAGE followed by immunoblotting with anti-GFP or M2 antibodies. GFP-SAC1 bands were quantified and compared with the relative levels of precipitated GFP-SAC1 from starved nonstimulated cells. Data represent means ± SD from three independent experiments. (D) NIH3T3 cells were grown as indicated. Pulse-chase analysis of protein secretion was conducted as described in Materials and methods. Data represent means ± SD from three independent experiments. (E) COS7 cells were transfected with a control plasmid without insert or with a plasmid for expressing flag-MKK3(Glu). Cells were serum-starved for 24 h and pulse-chase analysis of protein secretion was conducted as described in Materials and methods. Data represent means ± SD from three independent experiments.
Figure 5.
Figure 5.
RNAi-mediated depletion of SAC1 increases constitutive secretion and affects PI(4)P distribution in serum-starved cells. (A) COS7 cells were transfected with siRNAs directed against SAC1 or with mutated control siRNAs. Knockdown efficiency was determined by immunoblotting using anti-SAC1 and anti–glyceraldehyde-3-phosphate dehydrogenase (GAP-DH) antibodies. Cells were serum-starved for 24 h before pulse-chase analysis of protein secretion was conducted as described in Materials and methods. Data represent means ± SD from three independent experiments. (B) COS7 cells were transfected with siRNAs directed against SAC1 or with control siRNAs. Knockdown efficiency was determined by immunoblotting using anti-SAC1 and anti–glyceraldehyde-3-phosphate dehydrogenase antibodies. The cells were then serum-starved for 24 h and incubated in the presence or absence of 10 μM SB203580 for 30 min and then stimulated with serum for another 20 min followed by pulse-chase analysis of protein secretion as described in Materials and methods. Data represent means ± SD from three independent experiments. (C) COS7 cells were cotransfected with siRNAs directed against SAC1 and with plasmids for expressing either RNAi-resistant GFP-SAC1 (GFP-SAC1*, green) or an RNAi-resistant phosphatase-dead SAC1 mutant (GFP-SAC1-C/S*, green). Cells were serum starved for 24 h before being subjected to immunofluorescence microscopy using monoclonal anti-PI(4)P antibodies (red). Bar, 15 μm.
Figure 6.
Figure 6.
Localization of SAC1 to the Golgi down-regulates Golgi PI(4)P and slows anterograde traffic. (A) Quiescent NIH3T3 expressing flag-SAC1 or flag-SAC1-K2A was stimulated with 10% serum in the presence or absence of 10 μM SB203580. Pulse-chase analysis of protein secretion was conducted as described in Materials and methods. Data are means ± SD from three independent experiments. (B) COS7 cells infected with adenoviruses expressing either empty vector, flag-SAC1, flag-SAC1-K2A, or flag-SAC1-LZ were labeled with [3H]myo-inositol, and total cellular PIs were analyzed and quantified by HPLC analysis. Data are means ± SD from four to six independent experiments. *, P < 0.5 × 10⁻³. (C and D) Human fibroblasts infected with adenoviruses expressing either GFP-SAC1 (C, green) or GFP-SAC1-K2A (D, green) were grown in the presence of 15% (+serum) or 0.5% serum (quiescent) for 48 h. The cells were fixed, permeabilized, costained with anti-PI(4)P antibodies (red), and analyzed by immunofluorescence microcopy. Bars, 20 μm.
Figure 7.
Figure 7.
Mitogen-dependent regulation of SAC1 and PI(4)P signaling at the Golgi. Schematic illustration of cell growth–dependent control of PI(4)P signaling and Golgi trafficking by SAC1 lipid phosphatase. In quiescent cells, SAC1 oligomerizes and accumulates in the Golgi, which in turn down-regulates Golgi PI(4)P and constitutive secretion. After growth factor stimulation, p38 MAPK activity is required for dissociation of SAC1 complexes, which triggers retrograde traffic and redistribution of SAC1 to the ER. Reduction of SAC1 levels at the Golgi allows for elevated concentration of PI(4)P at this organelle, thus accelerating constitutive secretion.

References

    1. Acharya, U., A. Mallabiabarrena, J.K. Acharya, and V. Malhotra. 1998. Signaling via mitogen-activated protein-kinase kinase (MEK 1) is required for Golgi fragmentation during mitosis. Cell. 92:183–192. - PubMed
    1. Blagosklonny, M.V. 2006. Target for cancer therapy: proliferating cells or stem cells. Leukemia. 20:385–391. - PubMed
    1. Blagoveshchenskaya, A.D., M.J. Hannah, S. Allen, and D.F. Cutler. 2002. Selective and signal-dependent recruitment of membrane proteins to secretory granules formed by heterologously expressed von Willebrand factor. Mol. Biol. Cell. 13:1582–1593. - PMC - PubMed
    1. Cavalli, V., F. Vilbois, M. Corti, M.J. Marcote, K. Tamura, M. Karin, S. Arkinstall, and J. Gruenberg. 2001. The stress-induced MAP kinase p38 regulates endocytic trafficking via the GDI:Rab5 complex. Mol. Cell. 7:421–432. - PubMed
    1. De Matteis, M.A., A. Di Campli, and A. Godi. 2005. The role of the phosphoinositides at the Golgi complex. Biochim. Biophys. Acta. 1744:396–405. - PubMed

Publication types

MeSH terms

Substances