. 2008 Mar 17;205(3):611-24.
doi: 10.1084/jem.20070544. Epub 2008 Feb 25.

Antagonism of FOG-1 and GATA factors in fate choice for the mast cell lineage

Affiliations

Antagonism of FOG-1 and GATA factors in fate choice for the mast cell lineage

Alan B Cantor et al. J Exp Med. .

Abstract

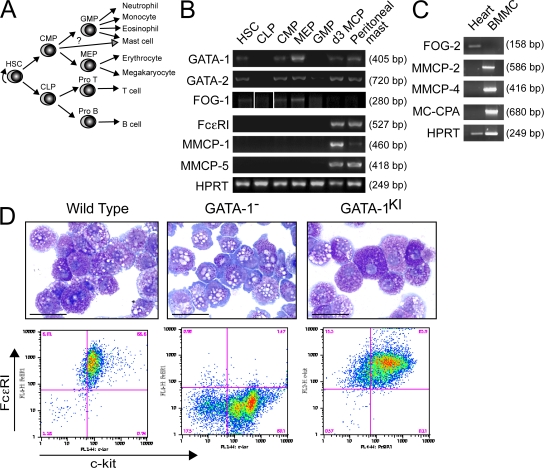
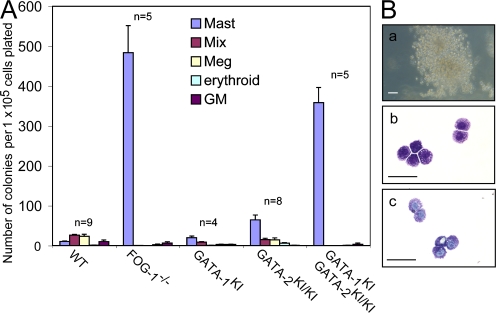
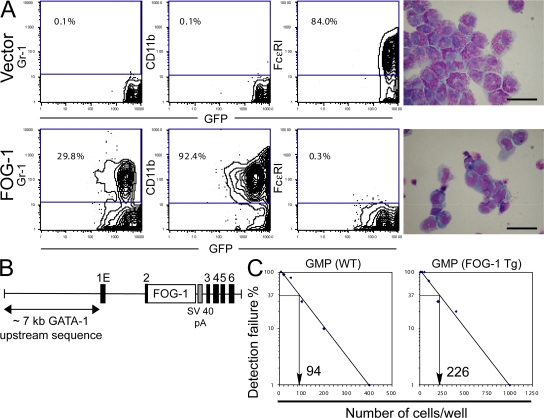
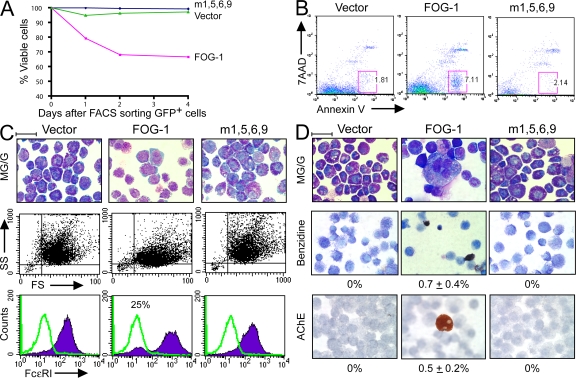
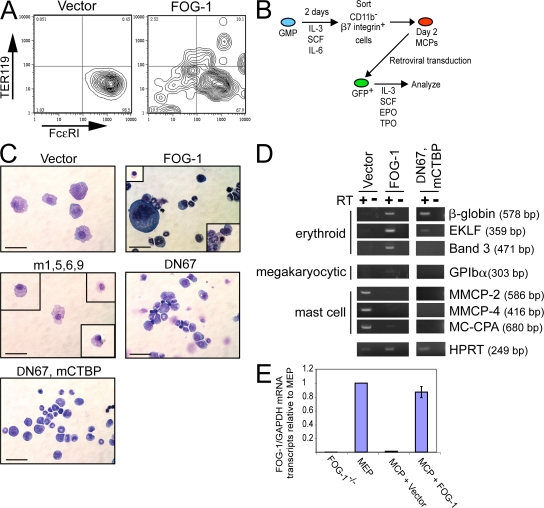
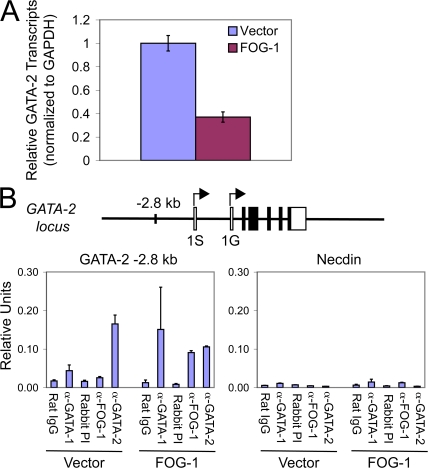
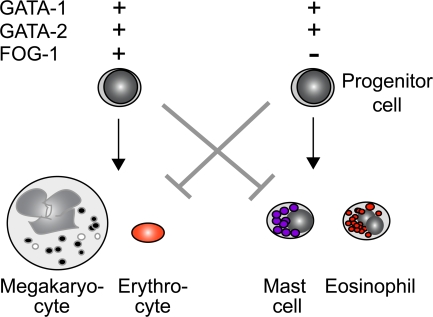
The zinc finger transcription factor GATA-1 requires direct physical interaction with the cofactor friend of GATA-1 (FOG-1) for its essential role in erythroid and megakaryocytic development. We show that in the mast cell lineage, GATA-1 functions completely independent of FOG proteins. Moreover, we demonstrate that FOG-1 antagonizes the fate choice of multipotential progenitor cells for the mast cell lineage, and that its down-regulation is a prerequisite for mast cell development. Remarkably, ectopic expression of FOG-1 in committed mast cell progenitors redirects them into the erythroid, megakaryocytic, and granulocytic lineages. These lineage switches correlate with transcriptional down-regulation of GATA-2, an essential mast cell GATA factor, via switching of GATA-1 for GATA-2 at a key enhancer element upstream of the GATA-2 gene. These findings illustrate combinatorial control of cell fate identity by a transcription factor and its cofactor, and highlight the role of transcriptional networks in lineage determination. They also provide evidence for lineage instability during early stages of hematopoietic lineage commitment.


Figures

Figure 1.
Figure 1.
GATA-1 functions independent of FOG cofactors in mast cell development. (A) Schematic diagram showing hierarchical relationships of the hematopoietic progenitor populations examined in B. (B) RT-PCR analysis of GATA-1, GATA-2, and FOG-1 expression in sorted progenitor cell populations, day 3 MCPs (d3 MCP), and peritoneal mast cells. FcεRI, MMCP-1, and MMCP-5 are included as mast cell–specific marker genes. HPRT serves as the housekeeping gene control. White lines indicate that intervening lanes have been spliced out. (C) RT-PCR analysis of FOG-2 expression in BMMCs (from 6-wk-old cultures) or whole mouse heart tissue. MMCP-2, MMCP-4, and MC-CPA are included as mast cell–specific markers. (D) May-Grunwald-Giemsa stains and FACS analysis for FcεRI and c-kit expression of YSMCs from wild-type, GATA-1, or GATA-1V205G(KI) male embryos. Bars, 10 μm.
Figure 2.
Figure 2.
Loss of FOG-1 results in an increased number of YSMC progenitors in vivo. (A) Yolk sac cultures from WT, FOG-1−/−, GATA-1V205G(KI) male, GATA-2V296G/V296G(KI/KI), and compound GATA-1KI, GATA-2KI/KI male embryonic day 9.5 embryos. Shown are numbers of mast cell, mixed (Mix), megakaryocytic (Meg), erythroid, and GM colonies per 105 cells plated and cultured in 2 IU/ml EPO, 5 ng/ml TPO, and rat 50 ng/ml SCF for 7 d. The number of animals analyzed for each is indicated above the graphs. Error bars represent the SEM. (B) Colony and cell morphology of mast cell colonies from GATA-1KI, GATA-2KI/KI male embryos. (a) Brightfield appearance of colony. Bar, 50 μm. (b) May-Grunwald-Giemsa stain of cytospun cells. Bar, 10 μm. (c) Toluidine blue stain of cytospun cells. Bar, 10 μm.
Figure 3.
Figure 3.
Enforced expression of FOG-1 blocks mast cell development. (A) FACS expression analysis for eGFP, Gr-1, CD11b, or FcεRI in GMPs transduced with retroviruses expressing eGFP alone (vector) or FOG-1–IRES-GFP (FOG-1), and cultured at limiting dilution in the presence of SCF, IL-3, IL-6, and IL-9 for 3 wk. Percentages of total cells that fall within the boxed FACS gates are shown. May-Grunwald-Giemsa stains of the GFP+ cells are shown on the right. Bars, 10 μm. (B) Schematic representation of the transgene used to express FOG-1 in the mast cell lineage. Approximately 7 kb of DNA 5′ to the first erythroid exon (1E) of GATA-1 (noncoding) were used. Full-length FOG-1 cDNA was inserted into exon 2 of GATA-1 upstream of the GATA-1 start codon, followed by an SV40 polyA sequence (gray box). Exons are indicated by black boxes. (C) Limiting dilution analysis of bone marrow GMPs from FOG-1–transgenic mice or wild-type littermates. The percentage of wells that failed to generate mast cells was scored, and the number of cells per well leading to a 37% detection failure rate was calculated.
Figure 4.
Figure 4.
Ectopic expression of FOG-1 in BMMCs represses mast cell phenotype and produces alternate lineage cells. (A) Percentage of viable GFP+ primary BMMCs retrovirally transduced with eGFP alone (vector), FOG-1–IRES-eGFP (FOG-1), or m1,5,6,9 FOG-1–IRES-GFP (m1,5,6,9). Viability was determined by Trypan blue dye exclusion. Time refers to days after FACS sorting of eGFP+ cells (2 d after retroviral infection). (B) FACS analysis for Annexin V (apoptosis marker) and 7-amino-actinomycin D (necrosis marker) expression of primary BMMCs transduced with each of the retroviral vectors described in A and examined 3 d after FACS sorting of GFP+ cells. Percentages of total cells that fall within the boxed FACS gates are shown. (C) May-Grunwald-Giemsa stains, FACS analysis showing side-scatter (SS) and forward scatter (FS), and FcεRI expression of primary BMMCs transduced with each of the retroviral vectors shown in A, sorted for GFP after 2 d, and cultured for 6 d in 2 U/ml EPO, 5 ng/ml TPO, 10 ng/ml IL-3, and 50 ng/ml SCF. (bottom) The green lines represent negative control staining for FcεRI (no IgE added; see Materials and methods). The purple histograms represent staining for FcεRI (IgE added). The percentage in the middle panel represents the proportion of total stained cells present within the negative staining control peak area. Bar, 10 μm. (D) May-Grunwald-Giemsa, o-dianisidine (benzidine), and acetylcholinesterase (AChE) histochemical stains of the cultures in C incubated for an additional 5 d. Benzidine+ cells stain black/brown; AChE+ cells stain orange. The percentage of positive-staining cells is indicated (±SEM; n = 2; 5,000 cells examined for all samples). Bar, 10 μm.
Figure 5.
Figure 5.
Ectopic expression of FOG-1 in MCPs blocks mast cell maturation and enables alternate lineage development. (A) FACS analysis for TER119 and FcεRI expression of clonal primary BMMCs retrovirally transduced with empty vector or FOG-1–IRES-eGFP–expressing retroviruses. GFP+ cells were sorted 2 d after retroviral infection and cultured in EPO, TPO, IL-3, and SCF for 6 d. (B) Scheme for isolation and retroviral infection of day 2 MCPs. (C) May-Grunwald-Giemsa stains of day 2 MCPs transduced with empty vector, FOG-1, or the FOG-1 mutants m1,5,6,9, ΔN67, and ΔN67, mCTBP expressing retroviruses; cultured in mast cell media containing EPO, TPO, SCF, and IL-3 for 4 d; sorted for GFP expression (GFP+ cells); and cultured for an additional of 5 d in mast cell media containing EPO, TPO, SCF, and IL-3. Boxes indicate cells seen in additional fields. Bars, 10 μm. (D) RT-PCR analysis for erythroid, megakaryocytic, and mast cell marker gene expression in the cells shown in C (harvested 5 d after sorting GFP+ cells). (E) Quantitative RT-PCR analysis for FOG-1 mRNA transcript levels in day 2 MCPs retrovirally transduced with the empty vector or FOG-1, sorted for GFP+ expression after 4 d, and cultured for an additional 5 d in the presence of SCF, IL-3, EPO, and TPO. Levels are displayed relative to those determined in parallel from sorted mouse MEPs and normalized to GAPDH mRNA transcript levels. The relative signal from FOG-1−/− cells (reference 10) is shown as an indicator of experimental background. All measurements were made in triplicate. The error bars represent the SEM.
Figure 6.
Figure 6.
FOG-1–mediated down-regulation of GATA-2 expression correlates with GATA factor switching at the −2.8-kb GATA-2 enhancer element in mast cells. (A) Quantitative RT-PCR analysis of GATA-2 mRNA transcript levels in GFP+ GMPs infected with retroviruses expressing either the empty vector (IRES-GFP) or FOG-1–IRES-GFP, sorted after 2 d, and analyzed immediately. Error bars represent SEM (n = 3). (B) ChIP assay examining occupancy of the GATA-2 −2.8-kb enhancer or the Necdin promoter by GATA-1, GATA-2, and/or FOG-1 in 4-wk-old BMMCs retrovirally transduced with either the empty vector (IRES-GFP) or FOG-1–IRES-GFP and sorted for GFP+ cells after 2 d. A schematic drawing of the mouse GATA-2 locus with the −2.8-kb enhancer element is indicated. 1S and 1G refer to different transcriptional start sites. Normal pooled rat IgG was used as the control for GATA-1 ChIP, and FOG-1 preimmune rabbit serum served as the control for FOG-1 and GATA-2 ChIPs. The level of detected amplicon was normalized to a standard curve of input chromatin and is indicated as relative units. Error bars represent the SEM (n = 2).
Figure 7.
Figure 7.
Model of combinatorial control of erythrocyte/megakaryocyte versus mast cell/eosinophil lineage commitment by GATA-1 and GATA-2 depending on the presence of FOG-1. + and − refer to the presence or absence, respectively, of expression of each gene. The arrows represent the favored differentiation pathway, and the gray “T” bars represent the blocked differentiation pathway.

References

    1. Zon, L.I., Y. Yamaguchi, K. Yee, E.A. Albee, A. Kimura, J.C. Bennett, S.H. Orkin, and S.J. Ackerman. 1993. Expression of mRNA for the GATA-binding proteins in human eosinophils and basophils: potential role in gene transcription. Blood. 81:3234–3241. - PubMed
    1. Ito, E., T. Toki, H. Ishihara, H. Ohtani, L. Gu, M. Yokoyama, J.D. Engel, and M. Yamamoto. 1993. Erythroid transcription factor GATA-1 is abundantly transcribed in mouse testis. Nature. 362:466–468. - PubMed
    1. Fujiwara, Y., C.P. Browne, K. Cunniff, S.C. Goff, and S.H. Orkin. 1996. Arrested development of embryonic red cell precursors in mouse embryos lacking transcription factor GATA-1. Proc. Natl. Acad. Sci. USA. 93:12355–12358. - PMC - PubMed
    1. Shivdasani, R.A., Y. Fujiwara, M.A. McDevitt, and S.H. Orkin. 1997. A lineage-selective knockout establishes the critical role of transcription factor GATA-1 in megakaryocyte growth and platelet development. EMBO J. 16:3965–3973. - PMC - PubMed
    1. Vyas, P., K. Ault, C.W. Jackson, S.H. Orkin, and R.A. Shivdasani. 1999. Consequences of GATA-1 deficiency in megakaryocytes and platelets. Blood. 93:2867–2875. - PubMed

Publication types

MeSH terms