. 2008 Mar 4;105(9):3443-8.
doi: 10.1073/pnas.0712384105. Epub 2008 Feb 25.

Chromatid cohesion defects may underlie chromosome instability in human colorectal cancers

Affiliations

Chromatid cohesion defects may underlie chromosome instability in human colorectal cancers

Thomas D Barber et al. Proc Natl Acad Sci U S A. .

Abstract

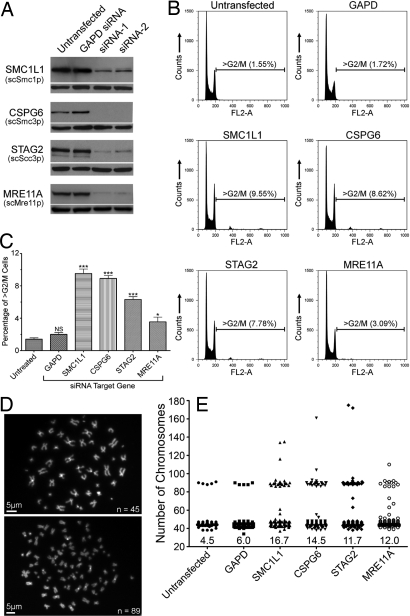
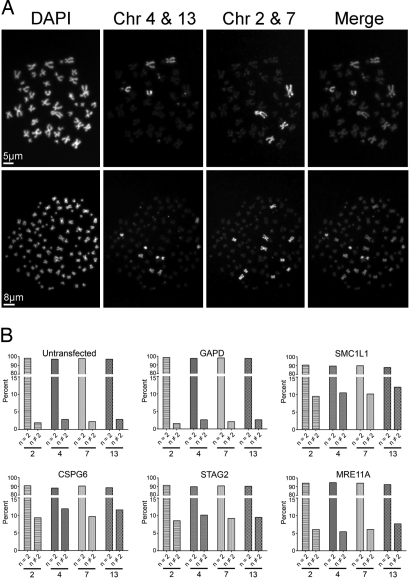
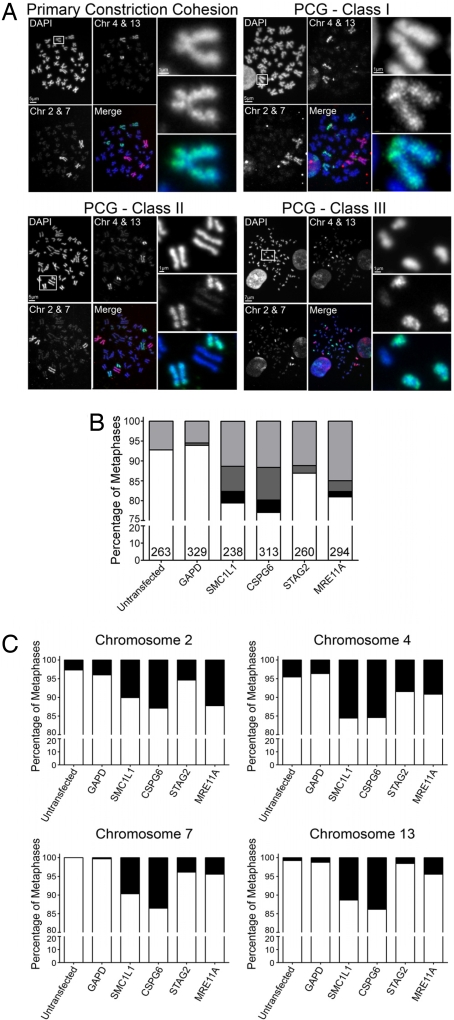
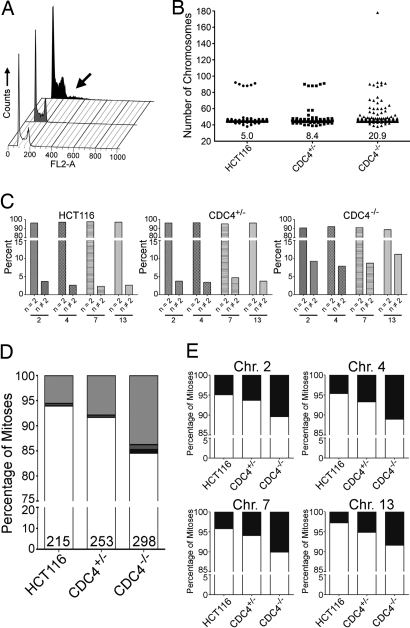
Although the majority of colorectal cancers exhibit chromosome instability (CIN), only a few genes that might cause this phenotype have been identified and no general mechanism underlying their function has emerged. To systematically identify somatic mutations in potential CIN genes in colorectal cancers, we determined the sequence of 102 human homologues of 96 yeast CIN genes known to function in various aspects of chromosome transmission fidelity. We identified 11 somatic mutations distributed among five genes in a panel that included 132 colorectal cancers. Remarkably, all but one of these 11 mutations were in the homologs of yeast genes that regulate sister chromatid cohesion. We then demonstrated that down-regulation of such homologs resulted in chromosomal instability and chromatid cohesion defects in human cells. Finally, we showed that down-regulation or genetic disruption of the two major candidate CIN genes identified in previous studies (MRE11A and CDC4) also resulted in abnormal sister chromatid cohesion in human cells. These results suggest that defective sister chromatid cohesion as a result of somatic mutations may represent a major cause of chromosome instability in human cancers.


Conflict of interest statement

The authors declare no conflict of interest.

Figures

Fig. 1.
Fig. 1.
Down-regulation of mutated gene products results in CIN in human cells. (A) Protein expression levels were examined by Western blot after siRNA-mediated knockdown of the genes indicated at the left (yeast protein names are shown in parentheses for reference purposes). Reprobing the same plots with anti-α-tubulin antibodies confirmed equal loading (shown below each targeted protein blot). (B) Asynchronous HCT116 cells were labeled with propidium iodide and subjected to flow cytometry. The bars delineate the G2/M population of cells with DNA contents greater than expected for cells in the G2/M phase of the cell cycle. The FL2-A channel has been left shifted (G0/G1 FL2-A ≈ 100; G2/M FL2-A ≈ 200) to include both the relatively small tetraploid (FL2-A ≈ 375) and octaploid (FL2-A ≈ 750) cell populations. (C) Graphs of the mean percentage of >G2/M cells (± SEM) after siRNA-induced knockdown of GAPD, SMC1L1, CSPG6, STAG2 and MRE11A. ***, P < 0.001; **, P < 0.01; *, P < 0.05; NS, P > 0.05. (D) Images of DAPI-stained mitotic spreads from untransfected cells (Upper, n = 45 chromosomes) and a markedly aneuploid cell after treatment with CSPG6 siRNA (Lower, n = 89 chromosomes). (E) Scatter plot depicting the total chromosome number distribution for cells treated with the indicated siRNA. At least 300 mitoses were evaluated for each scatter plot. Percentage of mitotic spreads with >46 chromosomes is indicated at the base of each column.
Fig. 2.
Fig. 2.
Instability of specific chromosomes in si-RNA treated cells. (A) Representative images of a near diploid (Upper) and near tetraploid (Lower) cells. Chromosomes 4 and 13 were pseudocolored green whereas chromosomes 2 and 7 were pseudocolored red in the merged images. (B) Graphical representations of the fraction of mitotic spreads with normal and aberrant numbers of chromosomes in cells treated with the indicated siRNAs. Each painted chromosome (indicated at the bottom of each panel) was determined to occur at either the normal number (two per spread) or at an aneuploid number (different from 2).
Fig. 3.
Fig. 3.
Down-regulation of mutated gene products induces cohesion defects. (A) Representative images of mitotic spreads demonstrating normal primary constriction cohesion (Upper Left) and various classes of defective cohesion; PCGI (mild), PCGII (moderate), and PCGIII (severe). Each cohesion category (quadrant) is composed of a low resolution image of the entire mitotic spread in which the DAPI (blue), FITC (green), Texas Red (red), and merged images are presented. Each DAPI image contains a white box that defines the region magnified and presented in the three right-hand panels of each quadrant. For illustrative and comparative purposes, the high-resolution images all contain an FITC-labeled chromosome 4. The high resolution merged image (Bottom) has the DAPI (Top) and FITC (Middle) channels pseudocolored blue and green, respectively. (B) Graphs of the fractions of cells with normal or defective cohesion of the three different classes (PCGI, light gray; PCGII, dark gray; and PCGIII, black). The total number of mitoses scored in each experiment is denoted at the bottom of each bar. (C) The fraction of metaphases with cohesion that was normal (white column) or abnormal (any of the three classes, black column) is presented for each of the four chromosomes studied in cells treated with the indicated siRNAs.
Fig. 4.
Fig. 4.
Cells with disrupted CDC4 exhibit cohesion defects. (A) Flow cytometric analyses of HCT116 control cell and those with heterozygous (CDC4+/−, gray) or homozygous (CDC4−/−, black) null alleles. The arrow highlights the CDC4−/− cells that exhibited increases in DNA content (i.e., aneuploidy). (B) Scatter plots depicting the total chromosome number distribution for at least 300 mitotic spreads from cells with the indicated genotype. Percentage of mitotic spreads with >46 chromosomes is indicated at the base of each column. (C) Bar graphs indicating the fraction of mitotic spreads with normal (n = 2) or abnormal (n ≠ 2) chromosome numbers as identified by whole chromosome paints. (D) Graphs of the fractions of cells with normal (white) or defective cohesion of the three different classes (PCGI, light gray; PCGII, dark gray; and PCGIII, black). The total number of mitoses scored in each experiment is denoted at the bottom of each bar. (E) The fraction of metaphases with cohesion that was normal (white column) or abnormal (any of the three classes, black column) is presented for each of the four chromosomes studied in cells with the indicated genotypes.

References

    1. Loeb LA. Mutator phenotype may be required for multistage carcinogenesis. Cancer Res. 1991;51:3075–3079. - PubMed
    1. Duesberg P, et al. How aneuploidy may cause cancer and genetic instability. Anticancer Res. 1999;19:4887–4906. - PubMed
    1. Lengauer C, Kinzler KW, Vogelstein B. Genetic instabilities in human cancers. Nature. 1998;396:643–649. - PubMed
    1. Weaver BA, Cleveland DW. Does aneuploidy cause cancer? Curr Opin Cell Biol. 2006;18:658–667. - PubMed
    1. Yamamoto H, Imai K, Perucho M. Gastrointestinal cancer of the microsatellite mutator phenotype pathway. J Gastroenterol. 2002;37:153–163. - PubMed

Publication types

MeSH terms

Substances