. 2008 Mar 4;105(9):3304-9.
doi: 10.1073/pnas.0705463105. Epub 2008 Feb 25.

Relationship between cellular response and behavioral variability in bacterial chemotaxis

Affiliations

Relationship between cellular response and behavioral variability in bacterial chemotaxis

Thierry Emonet et al. Proc Natl Acad Sci U S A. .

Abstract

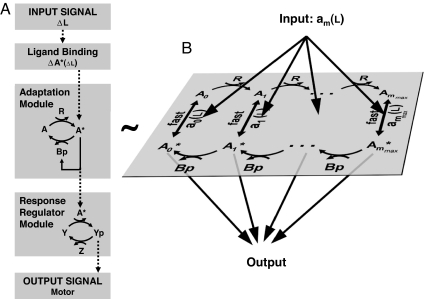
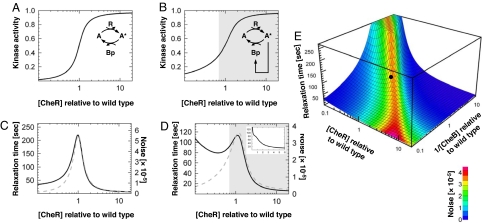
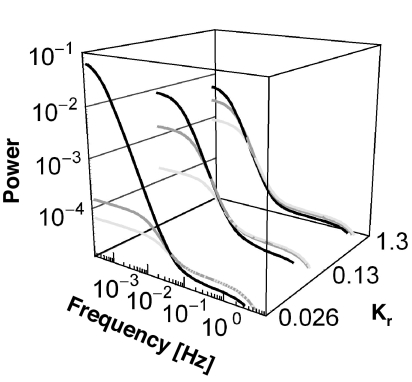
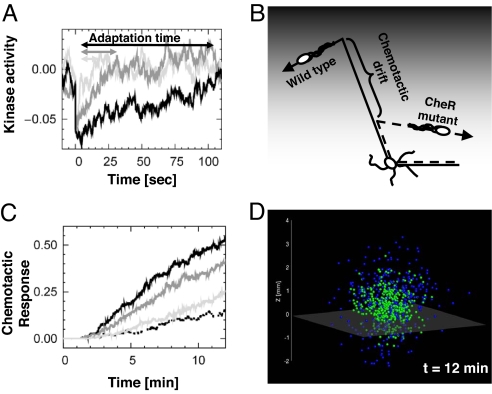
Over the last decades, bacterial chemotaxis in Escherichia coli has emerged as a canonical system for the study of signal transduction. A remarkable feature of this system is the coexistence of a robust adaptive behavior observed at the population level with a large fluctuating behavior in single cells [Korobkova E, Emonet T, Vilar JMG, Shimizu TS, Cluzel P (2004) Nature 428:574-578]. Using a unified stochastic model, we demonstrate that this coexistence is not fortuitous but a direct consequence of the architecture of this adaptive system. The methylation and demethylation cycles that regulate the activity of receptor-kinase complexes are ultrasensitive because they operate outside the region of first-order kinetics. As a result, the receptor-kinase that governs cellular behavior exhibits a sigmoidal activation curve. We propose that the steepness of this kinase activation curve simultaneously controls the behavioral variability in nonstimulated individual bacteria and the duration of the adaptive response to small stimuli. We predict that the fluctuating behavior and the chemotactic response of individual cells both peak within the transition region of this sigmoidal curve. Large-scale simulations of digital bacteria suggest that the chemotaxis network is tuned to simultaneously maximize both the random spread of cells in the absence of nutrients and the cellular response to gradients of attractant. This study highlights a fundamental relation from which the behavioral variability of nonstimulated cells is used to infer the timing of the cellular response to small stimuli.


Conflict of interest statement

The authors declare no conflict of interest.

Figures

Fig. 1.
Fig. 1.
Modular representation of the chemotaxis system. (A) Transmembrane receptors bind the ligand (L) and control the activity of histidine kinases CheA (A). The kinase CheA phosphorylates the response regulator CheY (Y) into the active form CheY-P (Yp). CheY-P diffuses throughout the cell and interacts with the flagellar motors to induce clockwise rotation (tumble). The phosphatase CheZ (Z) dephosphorylates CheY-P (42). A sudden increase of ligands ΔL causes the kinase activity to decrease by ΔA*. The chemotaxis system is equipped with an adaptation module in which two antagonistic enzymes regulate the activity of the kinase-receptor complexes. The methyltransferase CheR (R) catalyzes the autophosphorylation of CheA by methylating the receptors. The active kinase A* phosphorylates the methylesterase CheB in CheB-P (Bp). CheB-P removes methyl groups from active receptor complexes, which catalyzes kinase deactivation. (B) The adaptation module consists of a series of slow (de)methylation reactions that modulate the activity of the receptor complexes. We use a two-state model where the probability am of a receptor complex to be in active conformation depends on the occupancy of its ligand binding sites and on the level of methylation of the receptors that ranges within m = 0, …, mmax (, –19). mmax is the total number of methylation sites. We assume that CheR only methylates inactive complexes (43), whereas CheB-P only demethylates active complexes (44) (details on the model and alternative hypotheses in Sect. 4 of SI Appendix).
Fig. 2.
Fig. 2.
Sensitivity of the adaptation module without (A and C) and with (B, D, and E) the CheB-P feedback loop on CheA. (A) Total kinase activity Atot* as a function of [CheR] for a fixed wild-type level of [CheB] (model parameters in Table S1 of SI Appendix). Hill coefficient, H ∼ 3.5. (C) Relaxation time τa (black) and variance σa2 (gray) of the noise associated with the total kinase activity. (B and D) Same as A and C with the CheB-P feedback loop on CheA. H ∼ 2.5. Gray-shaded area, functioning range of the motor [1.5 < [CheY-P] < 4.5 μM (45)]. (Inset) Relaxation time averaged from a population of cells (104) with cell-to-cell variability in the levels of CheR and CheB (see Sect. 5 of SI Appendix). (E) Relaxation time (surface) and variance of the noise (color) associated with the total kinase activity as a function of [CheR] and 1/[CheB]. The black dot indicates the wild-type cell (Table S1 of SI Appendix).
Fig. 3.
Fig. 3.
Power spectra of the fluctuations of the output signal (CheY-P) from nonstimulated cells. Shown are 1-fold (black), 2-fold (gray), and 4-fold (light gray) wild-type levels of CheR for a fixed wild-type level of [CheB]. For Kr and Kb, the spectra are in agreement with experiments in ref. . For Kr and Kb 5 times smaller or 10 times larger, the differences between the power spectra of wild-type and mutants are too large or too small in comparison with those in ref. .
Fig. 4.
Fig. 4.
Relationship between relaxation time and chemotactic drift. (A) Temporal evolution of the kinase activity relative to steady state upon sudden deactivation of active receptor complexes for 1-fold (black), 2-fold (gray), and 4-fold (light gray) wild-type level of [CheR] and fixed wild-type level of [CheB]. We normalized the kinase activity with that of wild-type cells. Increasing [CheR] causes a reduction of the relaxation time τa. In all cases, the initial perturbation is ≈4.4% of the wild-type steady-state kinase activity (≈100 receptor complexes). Simulations of a single covalent modification cycle (Fig. 1A) using Stochastirator (http://web.mit.edu/endy/www/sections/resources.html) (parameters are in Table S1 of SI Appendix). (B) Role of the relaxation time in chemotaxis. Cells with longer relaxation time swim farther along the gradient of attractant (gray shade). (C) Effect of variations of [CheR] on the chemotactic response of a bacterial population of 400 cells. Digital swimming bacteria are exposed to a constant gradient of aspartate [dL/dz = 10−8 M/μm, L(z = 0) = 1 μM]. Shown is the percentage of cells in the gradient that are above z = 1 mm as a function of time: 1-fold (black), 2-fold (gray), and 4-fold (light gray) wild-type [CheR] level. Dashed line, wild-type response without gradient. The CW bias for mutant and wild-type cells is 0.23. The initial position of the bacteria is z = 0 mm. (D) Position of the cells from C with 1-fold (blue) and 4-fold (green) wild-type level of CheR after 12 min. Below the gray transparent plane (z = −0.1 mm) there is no nutrient, and bacteria perform an unbiased random walk. Above the plane the random walk is biased upward the gradient of aspartate.

References

    1. Pedraza JM, van Oudenaarden A. Science. 2005;307:1965–1969. - PubMed
    1. Raser JM, O'Shea EK. Science. 2004;304:1811–1814. - PMC - PubMed
    1. Raser JM, O'Shea EK. Science. 2005;309:2010–2013. - PMC - PubMed
    1. Austin DW, Allen MS, McCollum JM, Dar RD, Wilgus JR, Sayler GS, Samatova NF, Cox CD, Simpson ML. Nature. 2006;439:608–611. - PubMed
    1. Newman JRS, Ghaemmaghami S, Ihmels J, Breslow DK, Noble M, DeRisi JL, Weissman JS. Nature. 2006;441:840–846. - PubMed

Publication types

MeSH terms