. 2008 Mar 4;105(9):3628-33.
doi: 10.1073/pnas.0708930105. Epub 2008 Feb 25.

Pharmacological disruption of calcium channel trafficking by the alpha2delta ligand gabapentin

Affiliations

Pharmacological disruption of calcium channel trafficking by the alpha2delta ligand gabapentin

Jan Hendrich et al. Proc Natl Acad Sci U S A. .

Abstract

The mechanism of action of the antiepileptic and antinociceptive drugs of the gabapentinoid family has remained poorly understood. Gabapentin (GBP) binds to an exofacial epitope of the alpha(2)delta-1 and alpha(2)delta-2 auxiliary subunits of voltage-gated calcium channels, but acute inhibition of calcium currents by GBP is either very minor or absent. We formulated the hypothesis that GBP impairs the ability of alpha(2)delta subunits to enhance voltage-gated Ca(2+)channel plasma membrane density by means of an effect on trafficking. Our results conclusively demonstrate that GBP inhibits calcium currents, mimicking a lack of alpha(2)delta only when applied chronically, but not acutely, both in heterologous expression systems and in dorsal root-ganglion neurons. GBP acts primarily at an intracellular location, requiring uptake, because the effect of chronically applied GBP is blocked by an inhibitor of the system-L neutral amino acid transporters and enhanced by coexpression of a transporter. However, it is mediated by alpha(2)delta subunits, being prevented by mutations in either alpha(2)delta-1 or alpha(2)delta-2 that abolish GBP binding, and is not observed for alpha(2)delta-3, which does not bind GBP. Furthermore, the trafficking of alpha(2)delta-2 and Ca(V)2 channels is disrupted both by GBP and by the mutation in alpha(2)delta-2, which prevents GBP binding, and we find that GBP reduces cell-surface expression of alpha(2)delta-2 and Ca(V)2.1 subunits. Our evidence indicates that GBP may act chronically by displacing an endogenous ligand that is normally a positive modulator of alpha(2)delta subunit function, thereby impairing the trafficking function of the alpha(2)delta subunits to which it binds.


Conflict of interest statement

The authors declare no conflict of interest.

Figures
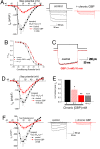
Fig. 1.
Fig. 1.
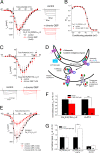
GBP is effective to inhibit IBa after heterologous expression, when applied chronically but not acutely. (A) (Left) Current density–voltage (IV) relationships for CaV2.1/β4/α2δ-2 currents in the absence or presence of chronic GBP (1 mM, red circles, n = 11) for ≈40 h (or H2O as control, black squares, n = 13) from immediately after transfection of tsA-201 cells until recordings were performed. The reduction in peak IBa at +15 mV was statistically significant (P = 0.0013, Student's two-tailed t test). (Right) Examples of currents resulting from step potentials from −90 mV to between −15 and +15 mV in 5-mV increments, under control conditions and in the presence of GBP. Calibration bars refer to both sets of traces. (B) Steady-state inactivation data were obtained from the cells treated as described in A. Chronic GBP (1 mM, red circles, n = 12) and control (black circles, n = 13). The steady-state inactivation in the absence of α2δ subunits is provided for comparison (dashed line, n = 11). Data are fit to a single Boltzmann equation. The V50,inact was 37.6 ± 2.1 mV in the presence of α2δ-2, −30.8 ± 4.4 mV in the absence of α2δ (dashed line), and −28.3 ± 2.7 mV in the continued presence of GBP (P = 0.0103 compared with the absence of GBP, Student's two-tailed t test). (C) GBP (1 mM) applied acutely for 10 min had no effect on CaV2.1/β4/α2δ-2 currents. Examples of currents resulting from step potentials from −90 mV to +10 mV, under control conditions and after application of GBP for 10 min, to a cell whose initial current amplitude had stabilized. Currents are representative of n = 5 cells, where the peak current (red trace) after application of GBP was 99.0 ± 7.1% of its initial value, before GBP application (black trace). (D) IV relationships for CaV2.1/β4/α2δ-2 currents from cells cultured in the absence or presence of 100 μM GBP applied chronically as described in A. GBP (red circles, n = 10) and control (black squares, n = 14). The reduction in peak IBa at +15 mV was statistically significant (P = 0.0215, Student's two-tailed t test). (E) The percentage of inhibition of peak current density by GBP (100 μM, hatched red bar, n = 10; and 1 mM, solid red bar, n = 11) was determined for each experiment and compared with the reduction observed in the absence of α2δ (gray bar, n = 14). The statistical significance of the reduction was determined relative to the data in the presence of α2δ-2 and absence of GBP for each individual set of experiments; *, P = 0.0013; **, P = 0.021; ***, P = 0.00004, Student's two-tailed t test. (F) (Left) IV relationships for CaV2.2/β1b/α2δ-1 currents in the absence or presence of chronic GBP (1 mM, red circles, n = 10) for ≈40 h or the equivalent amount of H2O as control (black squares, n = 8). (Right) Examples of currents resulting from step potentials from −90 mV to between −15 and +15 mV in 5-mV increments, under control conditions (black traces) and in the presence of GBP (red traces). Calibration bars refer to both sets of traces.
Fig. 2.
Fig. 2.
The effect of GBP requires both binding to the α2δ subunit and uptake by neutral amino acid transporter. (A) (Left) IV relationships for CaV2.1/β4/R282-α2δ-2 currents in the absence or presence of chronic GBP (1 mM, red circles, n = 12) for ≈40 h or the equivalent amount of H2O as control (black squares, n = 12), from immediately after transfection until recordings were performed. (Right) Examples of currents resulting from step potentials from −90 mV to between −15 and +15 mV in 5-mV increments under control conditions and in the presence of 1 mM GBP. Calibration bars refer to both sets of traces. (B) Steady-state inactivation data were obtained from the same cells as described in A. Chronic GBP (1 mM, red circles, n = 5) and control (black squares, n = 7). (C) (Upper) IV relationships for CaV2.2/β1b/R217A-α2δ-1 currents in the absence or presence of chronic GBP. The cDNAs were transfected into tsA-201 cells that were then incubated with GBP (1 mM, red circles, n = 5) for ≈40 h or the equivalent amount of H2O as control (black squares, n = 4), from immediately after transfection until recordings were performed. (Lower) Examples of currents resulting from step potentials from −90 mV to between −15 and +15 mV in 5-mV increments under control conditions and in the presence of 1 mM GBP. Calibration bars refer to both sets of traces. (D) Diagram illustrating some of the various sites at which GBP (red circles) or the putative endogenous ligand (green circles) may act on α2δ subunits. The effect of GBP may be to displace an endogenous ligand and impair the ability of α2δ-1 and α2δ-2 to increase VGCC concentration at the plasma membrane. Thus, GBP may exert its effect on intracellular α2δ subunits during maturation and trafficking of the VGCC complex to the plasma membrane and/or bind to cell surface α2δ subunits and affect recycling from the plasma membrane. BCH is a competitive inhibitor of system-L transport. (E) IV relationships for CaV2.1/β4/α2δ-2 currents either under control conditions (black squares, n = 8) or after chronic treatment with GBP (1 mM), in the absence (red filled circles, n = 7) or presence (red open circles, n = 10) of the inhibitor of system-L transport, BCH (10 mM) applied chronically from 1 h before GBP. The reduction in peak IBa by GBP alone at +10 mV was statistically significant compared with control (P = 0.0464, Student's two-tailed t test). (F) IBa was measured in Xenopus oocytes after injection of CaV2.2/β1b/α2δ-2 cDNAs, together with either a control cDNA (nonconducting Kir2.1-AAA (30) (Left) or with mLAT4 (27) (Right). Oocytes were incubated without (black bars) or with 200 μM GBP (red bars) from 1 h after the time of injection until recording between 40 and 48 h later. To combine data from several experiments, the mean peak control IBa at +5 mV was normalized and the effect of GBP determined relative to control. The numbers of determinations are shown on the bars. Statistical significance: **, P = 0.0042 for the effect of GBP in the mLAT4 condition only (two-way ANOVA and Bonferroni's post hoc test). (G) As in E, with the combinations of transfected subunits indicated below the bars. Oocytes were incubated without (black bars) or with (white bars) 400 μM l-leucine. The statistical significance is P = 0.011 (*) for the effect of l-leucine in the mLAT4 condition and only in the presence of α2δ-2.
Fig. 3.
Fig. 3.
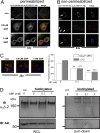
Effect of chronic GBP on the plasma membrane localization of CaV2.1 and α2δ-2 in COS-7 cells. (A) CaV2.1–2HA was cotransfected with β4 and α2δ-2 and cultured for 48 h either in the absence or in the presence of GBP (100 μM or 1 mM). Cells were then fixed and permeabilized before immunocytochemical localization of CaV2.1 (HA Ab, Left) and α2δ-2 [α2-2 (102–117) Ab, Center], by using a magnification ×63 objective. Merged images are shown (Right) (CaV2.1 is shown in green and α2δ-2 in red, with regions of colocalization in orange–yellow). Nuclear staining (blue, DAPI) is shown in the merged images. Images show 1-μm optical sections of data representative of three independent experiments. (Scale bar: 30 μm.) No signal was observed in nontransfected cells or in the absence of primary Abs (data not shown). (B) Images are obtained as in A, but cells were not permeabilized. The transfected cell(s) in each image are identified by an arrow. Similar results were obtained in three independent experiments. (Scale bar: 30 μm.) (C) (Left) Merged images of nonpermeabilized cells taken with a magnification ×20 objective to show a larger field of view for cells transfected as in A and cultured for 48 h either in the absence or in the presence of GBP (100 μM or 1 mM). The optical section for these images is 4.5 μm, and, as the cells are flattened, staining is seen over most of the cell surface. (Scale bar: 60 μm.) (Right) Quantification of cell-surface fluorescence intensity per cell area for CaV2.1 (white bars) and α2δ-2 (gray bars) from magnification ×20 images under control conditions (n = 22 cells) and in the presence of 100 μM GBP (n = 19 cells) and 1 mM GBP (n = 24 cells). **, P < 0.01; ***, P < 0.001; one-way ANOVA, with Bonferroni's post hoc test. (D) The effect of GBP (100 μM and 1 mM) was determined on cell-surface expression of α2δ-2 (Upper), with the intracellular protein Akt as control (Lower). (Left) Whole-cell lysate (WCL). (Right) Streptavidin pull-down of biotinylated proteins, immunoblotted with α2-2 (102–117) or Akt Ab. The leftmost lane is from nonbiotinylated control cells (con). The proportion of α2δ-2 at the cell surface was estimated from the ratio of the biotinylated α2δ-2 to the amount of α2δ-2 in the WCL. Data are from five experiments; 4.93 ± 1.92% of total α2δ-2 was at the plasma membrane, and this was reduced compared with control by 19.8 ± 7.6% and 30.4 ± 14.4% in the chronic presence of 100 μM and 1 mM GBP, respectively (n = 5, P < 0.05, repeated-measures ANOVA and Bonferroni's post hoc test).
Fig. 4.
Fig. 4.
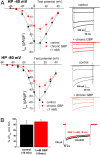
Effect of GBP on native calcium currents in DRGs. (A) (Upper Left) IV relationships for HVA IBa recorded from rat DRGs cultured for 3 days in the absence (black squares, n = 22) or presence of GBP (1 mM, red circles, n = 19). (Upper Right) Example HVA currents from a holding potential (VH) of −40 mV to between −30 and +10 mV in 10-mV steps. Upper traces (black) control; lower traces (red) chronic GBP (1 mM). IBa was measured at 20 ms, as indicated by the dotted line. IBa at 0 mV was significantly inhibited by chronic GBP (P = 0.02, Student's two-tailed t test). (Lower) As above, except VH was −80 mV, and IBa amplitude was measured at the end of the 220-ms step, as indicated by the dotted line. IBa was obtained in the absence (black squares, n = 12), or presence of GBP (1 mM, red circles, n = 13). (B) Acute application of GBP (1 mM) had no effect on native DRG HVA currents. (Left) Bar chart showing lack of effect of perfusion for 10 min of control medium (black bar) or GBP (1 mM, red bar) to cells whose initial current amplitude had stabilized (n = 6 for each). (Right) Examples of currents resulting from a step potential from VH −40 mV to +10 mV under control conditions (black trace) and from the same cell after application of GBP (red trace) for 10 min.

References

    1. Davies A, et al. Functional biology of the alpha(2)delta subunits of voltage-gated calcium channels. Trends Pharmacol Sci. 2007;28:220–228. - PubMed
    1. Dolphin AC. β subunits of voltage-gated calcium channels. J Bioeng Biomemb. 2003;35:599–620. - PubMed
    1. Catterall WA. Structure and regulation of voltage-gated Ca2+ channels. Annu Rev Cell Dev Biol. 2000;16:521–555. - PubMed
    1. Arikkath J, Campbell KP. Auxiliary subunits: Essential components of the voltage-gated calcium channel complex. Curr Opin Neurobiol. 2003;13:298–307. - PubMed
    1. Jay SD, et al. Structural characterization of the dihydropyridine-sensitive calcium channel α2-subunit and the associated δ peptides. J Biol Chem. 1991;266:3287–3293. - PubMed

Publication types