

gamma-Tocopherol Accelerated Sodium Excretion in a Dose-Dependent Manner in Rats with a High Sodium Intake
- PMID: 18299718
- PMCID: PMC2243243
- DOI: 10.3164/jcbn.2007030
gamma-Tocopherol Accelerated Sodium Excretion in a Dose-Dependent Manner in Rats with a High Sodium Intake
Abstract
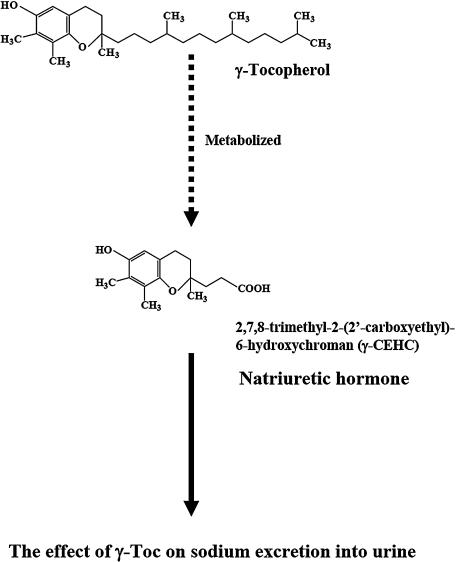
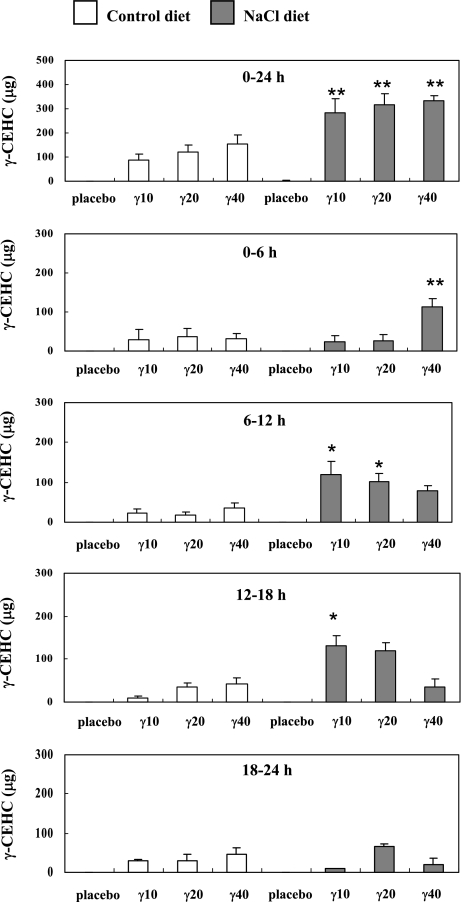
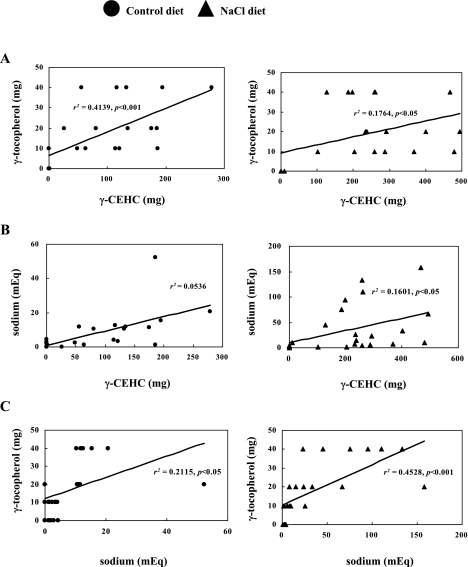
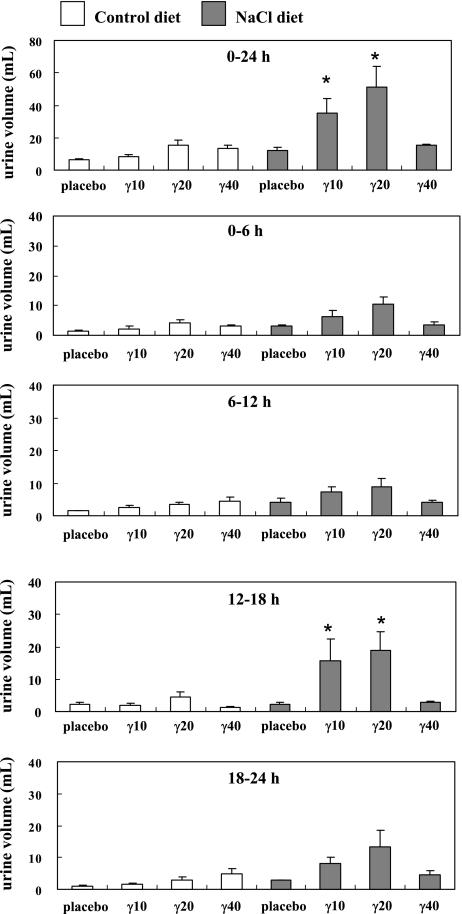
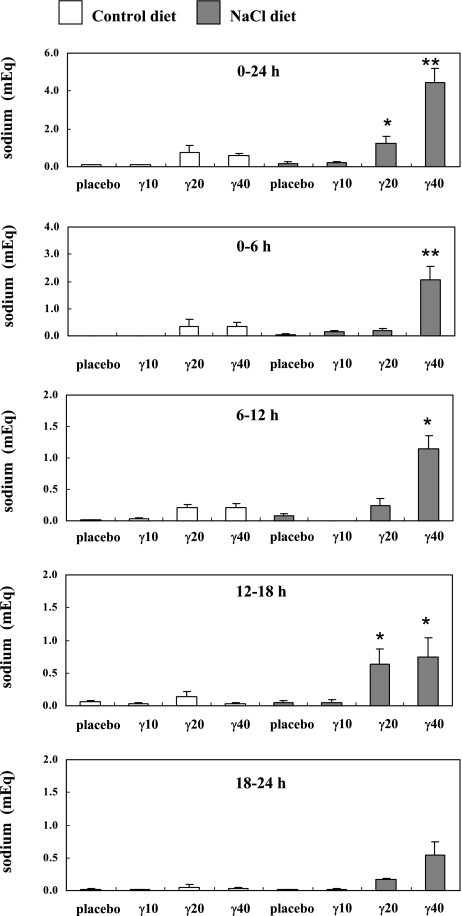
We have previously reported that gamma-tocopherol (gamma-Toc) displays a natriuretic potency in rats fed a NaCl diet and administered 20 mg gamma-Toc. In this study, we investigated whether gamma-Toc has natriuretic potency at a dose lower or higher than 20 mg in rats given a NaCl diet. Male rats were fed a control diet or a NaCl diet and administered either placebo or 10, 20 or 40 mg of gamma-Toc. The rat urine was collected for 24 hours (divided into 6 hour periods) and the 2,7,8-trimethyl-2-(2'-carboxyethyl)-6-hydroxychroman (gamma-CEHC) level, the sodium excretion content, and the urine volume were determined. The 24-hour gamma-CEHC and sodium levels in the urine of the NaCl groups given 20 mg or 40 mg gamma-Toc were significantly higher than those in the placebo group. The peak levels of urine sodium and gamma-CEHC in the NaCl group given 40 mg gamma-Toc appeared at 0-6 h, which was a more rapid increase than that seen in the group given 20 mg gamma-Toc. The 24-hour urine volumes of the NaCl groups given 10 and 20 mg gamma-Toc were significantly higher than the urine volume of the placebo group. Our findings suggested that gamma-Toc increased sodium excretion in a dose-dependent manner in rats fed a NaCl diet. Moreover, a high dose of gamma-Toc may accelerate its metabolism and cause an increase in the rate of sodium excretion.
Keywords: natriuretic hormone; sodium excretion; γ-CEHC; γ-tocopherol.
Figures
Similar articles
-
Gamma-tocopherol enhances sodium excretion as a natriuretic hormone precursor.J Nutr Sci Vitaminol (Tokyo). 2004 Aug;50(4):277-82. doi: 10.3177/jnsv.50.277. J Nutr Sci Vitaminol (Tokyo). 2004. PMID: 15527070
-
Alpha-tocopherol affects the urinary and biliary excretion of 2,7,8-trimethyl-2 (2'-carboxyethyl)-6-hydroxychroman, gamma-tocopherol metabolite, in rats.Lipids. 2001 May;36(5):467-72. doi: 10.1007/s11745-001-0744-2. Lipids. 2001. PMID: 11432458
-
Gamma-tocotrienol, a vitamin E homolog, is a natriuretic hormone precursor.J Lipid Res. 2003 Aug;44(8):1530-5. doi: 10.1194/jlr.M300061-JLR200. Epub 2003 May 1. J Lipid Res. 2003. PMID: 12730299
-
Effect of γ-tocopherol supplementation on premenstrual symptoms and natriuresis: a randomized, double-blind, placebo-controlled study.BMC Complement Med Ther. 2023 Apr 28;23(1):136. doi: 10.1186/s12906-023-03962-5. BMC Complement Med Ther. 2023. PMID: 37118716 Free PMC article. Clinical Trial.
-
gamma-tocopherol, the major form of vitamin E in the US diet, deserves more attention.Am J Clin Nutr. 2001 Dec;74(6):714-22. doi: 10.1093/ajcn/74.6.714. Am J Clin Nutr. 2001. PMID: 11722951 Review.
Cited by
-
Changes in the concentrations of vitamin E analogs and their metabolites in rat liver and kidney after oral administration.J Clin Biochem Nutr. 2015 Mar;56(2):143-8. doi: 10.3164/jcbn.14-107. Epub 2015 Jan 20. J Clin Biochem Nutr. 2015. PMID: 25759520 Free PMC article.
-
Dietary intake of tocopherols and risk of incident disabling dementia.Sci Rep. 2021 Aug 12;11(1):16429. doi: 10.1038/s41598-021-95671-7. Sci Rep. 2021. PMID: 34385499 Free PMC article.
References
-
- Cailar D.U., Ribstein J., Mimran A. Dietary sodium and target organ damage in essential hypertension. Am. J. Hyperten. 2002;15:222–229. - PubMed
-
- Antonios T.F., Macgregor G.A. Salt intake: potential deleterious effects excluding blood pressure. J. Hum. Hypertens. 1995;9:511–515. - PubMed
-
- Yamori Y., Liu L., Mu L., Zhao H., Pen Y., Hu Z., Kuga S., Negishi H., Ikeda K. Japan-China cooperative study group. chongqing project. Diet-related factors, educational levels and blood pressure in a Chinese population sample: findings from the Japan-China Cooperative Research Project. Hypertens. Res. 2002;25:559–564. - PubMed
-
- Ministry of Health, Labor and Welfare, Japan. The National Nutrition Survey in Japan 2002. Dai-ichi Shuppan Press; Tokyo: 2004. p. 182.
-
- Kingman M.S., Thompson B.S., Newkirk T., Torres F. Nesiritide for pulmonary arterial hypertension with decompensated cor pulmonale. Prog. Cardiovasc. Nurs. 2005;20:168–172. - PubMed