

Automatic seizure detection based on time-frequency analysis and artificial neural networks
- PMID: 18301712
- PMCID: PMC2246039
- DOI: 10.1155/2007/80510
Automatic seizure detection based on time-frequency analysis and artificial neural networks
Abstract
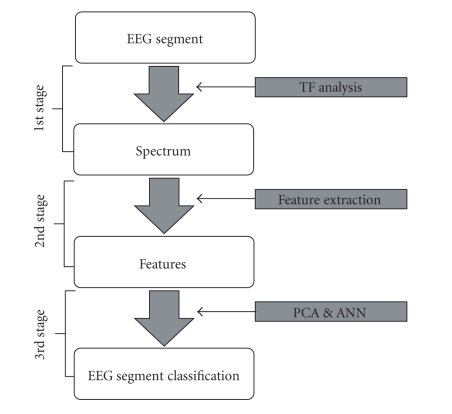
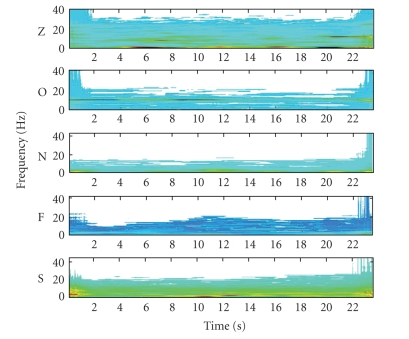
The recording of seizures is of primary interest in the evaluation of epileptic patients. Seizure is the phenomenon of rhythmicity discharge from either a local area or the whole brain and the individual behavior usually lasts from seconds to minutes. Since seizures, in general, occur infrequently and unpredictably, automatic detection of seizures during long-term electroencephalograph (EEG) recordings is highly recommended. As EEG signals are nonstationary, the conventional methods of frequency analysis are not successful for diagnostic purposes. This paper presents a method of analysis of EEG signals, which is based on time-frequency analysis. Initially, selected segments of the EEG signals are analyzed using time-frequency methods and several features are extracted for each segment, representing the energy distribution in the time-frequency plane. Then, those features are used as an input in an artificial neural network (ANN), which provides the final classification of the EEG segments concerning the existence of seizures or not. We used a publicly available dataset in order to evaluate our method and the evaluation results are very promising indicating overall accuracy from 97.72% to 100%.
Figures


Similar articles
-
The use of time-frequency distributions for epileptic seizure detection in EEG recordings.Annu Int Conf IEEE Eng Med Biol Soc. 2007;2007:3-6. doi: 10.1109/IEMBS.2007.4352208. Annu Int Conf IEEE Eng Med Biol Soc. 2007. PMID: 18001874
-
Classification of EEG signals using neural network and logistic regression.Comput Methods Programs Biomed. 2005 May;78(2):87-99. doi: 10.1016/j.cmpb.2004.10.009. Comput Methods Programs Biomed. 2005. PMID: 15848265
-
Epileptic seizure detection using multiwavelet transform based approximate entropy and artificial neural networks.J Neurosci Methods. 2010 Oct 30;193(1):156-63. doi: 10.1016/j.jneumeth.2010.08.030. Epub 2010 Sep 15. J Neurosci Methods. 2010. PMID: 20817036
-
Automatic epileptic seizure detection in EEGs based on line length feature and artificial neural networks.J Neurosci Methods. 2010 Aug 15;191(1):101-9. doi: 10.1016/j.jneumeth.2010.05.020. Epub 2010 Jun 2. J Neurosci Methods. 2010. PMID: 20595035
-
Automated Epileptic Seizure Detection in Pediatric Subjects of CHB-MIT EEG Database-A Survey.J Pers Med. 2021 Oct 15;11(10):1028. doi: 10.3390/jpm11101028. J Pers Med. 2021. PMID: 34683169 Free PMC article. Review.
Cited by
-
Reliable epileptic seizure detection using an improved wavelet neural network.Australas Med J. 2013 May 30;6(5):308-14. doi: 10.4066/AMJ.2013.1640. Print 2013. Australas Med J. 2013. PMID: 23745153 Free PMC article.
-
Topological exploration of artificial neuronal network dynamics.Netw Neurosci. 2019 Jul 1;3(3):725-743. doi: 10.1162/netn_a_00080. eCollection 2019. Netw Neurosci. 2019. PMID: 31410376 Free PMC article.
-
Enhanced Laterality Index: A Novel Measure for Hemispheric Asymmetry.J Healthc Eng. 2022 Apr 29;2022:8997108. doi: 10.1155/2022/8997108. eCollection 2022. J Healthc Eng. 2022. PMID: 35529543 Free PMC article.
-
Foundations of Time Series Analysis.Acta Neurochir Suppl. 2022;134:215-220. doi: 10.1007/978-3-030-85292-4_25. Acta Neurochir Suppl. 2022. PMID: 34862545
-
Classification of epileptic seizures using wavelet packet log energy and norm entropies with recurrent Elman neural network classifier.Cogn Neurodyn. 2017 Feb;11(1):51-66. doi: 10.1007/s11571-016-9408-y. Epub 2016 Sep 12. Cogn Neurodyn. 2017. PMID: 28174612 Free PMC article.
References
-
- Mormann F, Andrzejak RG, Elger CE, Lenhnertz K. Seizure prediction: the long and winding road. Brain. 2006;130(2):313–333. - PubMed
-
- Litt B, Echauz J. Prediction of epileptic seizures. Lancet Neurology. 2002;1(1):22–30. - PubMed
-
- Lehnertz K, Mormann F, Kreuz T, et al. Seizure prediction by nonlinear EEG analysis. IEEE Engineering in Medicine and Biology Magazine. 2003;22(1):57–63. - PubMed
-
- Waterhouse E. New horizons in ambulatory electroencephalography. IEEE Engineering in Medicine and Biology Magazine. 2003;22(3):74–80. - PubMed
-
- McGrogan N. Neural network detection of epileptic seizures in the electroencephalogram [Ph.D. thesis] Oxford, UK: Oxford University; 1999. Feb,
LinkOut - more resources
Full Text Sources
Other Literature Sources
Research Materials
