. 2008 Feb 27;3(2):e1697.
doi: 10.1371/journal.pone.0001697.

Influenza A H5N1 immigration is filtered out at some international borders

Affiliations

Influenza A H5N1 immigration is filtered out at some international borders

Robert G Wallace et al. PLoS One. .

Abstract

Background: Geographic spread of highly pathogenic influenza A H5N1, the bird flu strain, appears a necessary condition for accelerating the evolution of a related human-to-human infection. As H5N1 spreads the virus diversifies in response to the variety of socioecological environments encountered, increasing the chance a human infection emerges. Genetic phylogenies have for the most part provided only qualitative evidence that localities differ in H5N1 diversity. For the first time H5N1 variation is quantified across geographic space.

Methodology and principal findings: We constructed a statistical phylogeography of 481 H5N1 hemagglutinin genetic sequences from samples collected across 28 Eurasian and African localities through 2006. The MigraPhyla protocol showed southern China was a source of multiple H5N1 strains. Nested clade analysis indicated H5N1 was widely dispersed across southern China by both limited dispersal and long distance colonization. The UniFrac metric, a measure of shared phylogenetic history, grouped H5N1 from Indonesia, Japan, Thailand and Vietnam with those from southeastern Chinese provinces engaged in intensive international trade. Finally, H5N1's accumulative phylogenetic diversity was greatest in southern China and declined beyond. The gradient was interrupted by areas of greater and lesser phylogenetic dispersion, indicating H5N1 migration was restricted at some geopolitical borders. Thailand and Vietnam, just south of China, showed significant phylogenetic clustering, suggesting newly invasive H5N1 strains have been repeatedly filtered out at their northern borders even as both countries suffered recurring outbreaks of endemic strains. In contrast, Japan, while successful in controlling outbreaks, has been subjected to multiple introductions of the virus.

Conclusions: The analysis demonstrates phylogenies can provide local health officials with more than hypotheses about relatedness. Pathogen dispersal, the functional relationships among disease ecologies across localities, and the efficacy of control efforts can also be inferred, all from viral genetic sequences alone.


Conflict of interest statement

Competing Interests: The authors have declared that no competing interests exist.

Figures

Figure 1
Figure 1. H5N1 Migration as Inferred by Parsimony.
Map of H5N1 migration events inferred by parsimony through maximum likelihood phylogeny for 481 hemagglutinin nucleotide sequences sampled across 28 Eurasian and African localities 1996–2006 (2≤n≤65 isolates per locality). Orange vectors are statistically significant (α = .05) under an upper-tail Monte Carlo test of 10,000 trials and a sparse false discovery rate (sFDR) correction. Non-significant vectors are color-coded by Monte Carlo P value: the brighter the yellow, the greater the support. Quintiles are defined by breaks in ranked P values of more than .01, except within the final quintile. The map is based on satellite photos made available in World Wind 1.4 (http://worldwind.arc.nasa.gov/).
Figure 2
Figure 2. H5N1 Migration in Southern China.
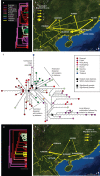
a) H5N1 migration events as assigned by parsimony for 67 samples of a single clade 2.3 H5N1 strain circulating in southern China 2005–2006 and b) mapped onto a World Wind satellite photo. c) Statistical parsimony haplotype network for same 67 samples. Rectangle represents the hypothesized ancestral genotype. All genotypes, except two, are represented by a single isolate. The exceptions are represented by two isolates (‘2’). Squares represent significant nested clade distances and triangles significant within clade distances as determined by nested clade analysis. Black shapes represent nodes at which subclades express significantly greater distances than expected by chance begin and extend to the tips of the branch. Gray shapes represent the starting node of a subclade of lesser distance than expected by chance. d) Migration events through section of H5N1 maximum likelihood tree showing 49 samples of a single clade 2.3 H5N1 strain circulating in southern China 2004–2006 and sister group to the 67 isolates shown in (a). e) The migration events for the 49 isolates mapped onto a World Wind satellite photo.
Figure 3
Figure 3. UniFrac PCA of H5N1 Shared History by Locality.
First three principal components for PCA of UniFrac metric for 481 H5N1 hemagglutinin sequences across 28 localities. Localities in red are situated in southern China, in dark red southwestern China (Hunan, Guizhou, Yunnan, and Guangxi), in pink northern China, in green in nearby Asian countries (Indonesia, Japan, Thailand, and Vietnam), and in olive green regions reached by the Qinghai-like strain (e.g., Mongolia, Crimea, Iraq, Africa). Localities referred to in the text include FJ = Fujian, GD = Guangdong, HK = Hong Kong, HU = Hunan, IN = Indonesia, IT = Italy, JA = Japan, TH = Thailand, VN = Vietnam.
Figure 4
Figure 4. Phylogenetic Dispersion Across H5N1 Localities.
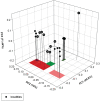
Net relatedness index (NRI) across 28 localities listed by great circle distance (km) from Guangdong. The upper-tail P values for the Monte Carlo test for phylogenetic clustering are colorized along a grayscale and shown in boxes at the tips of their respective index bars.
Figure 5
Figure 5. Generalized Mantel Test Across H5N1 Distance Matrices.
Pairwise Mantel test for correspondence based on Spearman correlation ranks for six distance matrices defined for H5N1 phylogeny of 481 hemagglutinin nucleotide sequences across 28 Eurasian and African localities: 1) migration events through the phylogeny symmetricized across the migration matrix diagonal (SME), 2) differences in isolates sample size (SS), 3) geographic distances (Geo), 4) UniFrac distances, 5) mean phylogenetic distances (MPD), and 6) mean nearest neighbor distances (MNND). Correlations are blocked out in color and upper-tail P values in gray scale. P values for pairwise comparisons between localities significant under false discovery rate correction are boxed in gold borders.

References

    1. Yuen KY, Wong SS. Human infection by avian influenza A H5N1. Hong Kong Med J. 2005;11:189–199 (2005). - PubMed
    1. Kandun IN, Wibisono H, Sedyaningsih ER, Yusharmen, Hadisoedarsuno W, et al. Three Indonesian clusters of H5N1 virus infection in 2005. N Engl J Med. 2006;355:2186–2194. - PubMed
    1. Yang Y, Halloran ME, Sugimoto J, Longini IM. Detecting human-to-human transmission of avian influenza A (H5N1). Emerg Infect Dis. 2007;13:1348–1353. - PMC - PubMed
    1. Salzberg SL, Kingsford C, Cattoli G, Spiro DJ, Janies DA, et al. Genome analysis linking recent European and African influenza (H5N1) viruses. Emerg Infect Dis. 2007;13:713–718. - PMC - PubMed
    1. Rweyemamu M, Paskin R, Benkirane A, Martin V, Roeder P, et al. Emerging diseases of Africa and the Middle East. Annals of New York Academy of Sciences. 2000;916:61–70. - PubMed

Publication types