. 2008 Feb 27:7:22.
doi: 10.1186/1476-4598-7-22.

In silico analysis of gastric carcinoma Serial Analysis of Gene Expression libraries reveals different profiles associated with ethnicity

Affiliations

In silico analysis of gastric carcinoma Serial Analysis of Gene Expression libraries reveals different profiles associated with ethnicity

Francisco J Ossandon et al. Mol Cancer. .

Abstract

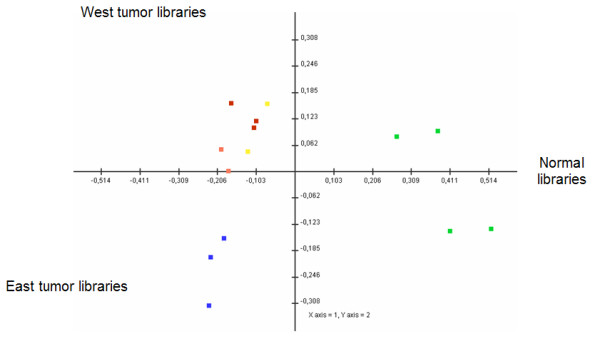
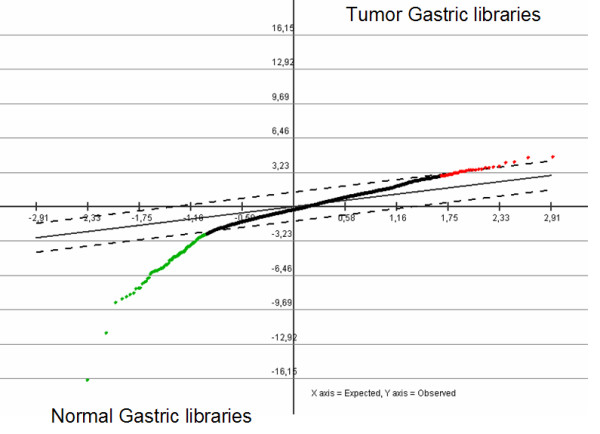
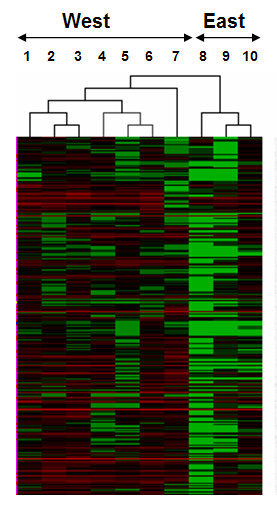
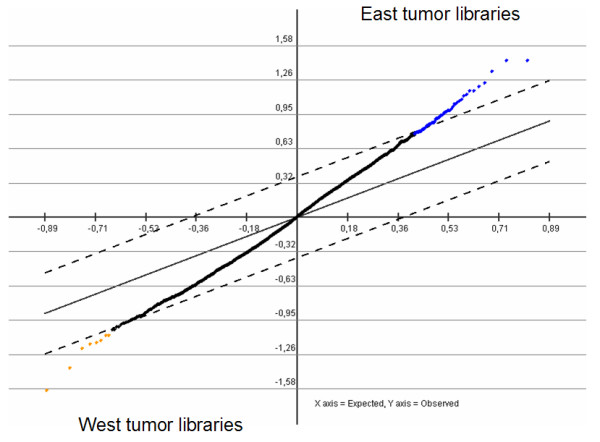
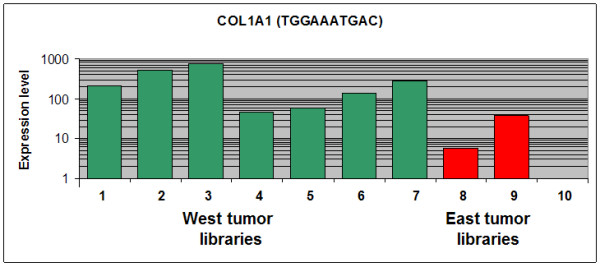
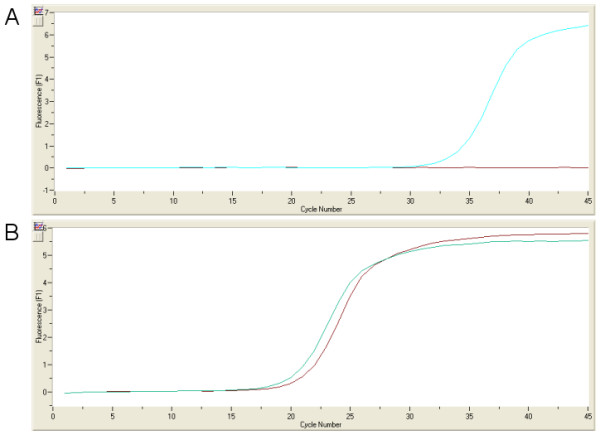
Worldwide gastric carcinoma has marked geographical variations and worse outcome in patients from the West compared to the East. Although these differences has been explained by better diagnostic criteria, improved staging methods and more radical surgery, emerging evidence supports the concept that gene expression differences associated to ethnicity might contribute to this disparate outcome. Here, we collected datasets from 4 normal and 11 gastric carcinoma Serial Gene Expression Analysis (SAGE) libraries from two different ethnicities. All normal SAGE libraries as well as 7 tumor libraries were from the West and 4 tumor libraries were from the East. These datasets we compare by Correspondence Analysis and Support Tree analysis and specific differences in tags expression were identified by Significance Analysis for Microarray. Tags to gene assignments were performed by CGAP-SAGE Genie or TAGmapper. The analysis of global transcriptome shows a clear separation between normal and tumor libraries with 90 tags differentially expressed. A clear separation was also found between the West and the East tumor libraries with 54 tags differentially expressed. Tags to gene assignments identified 15 genes, 5 of them with significant higher expression in the West libraries in comparison to the East libraries. qRT-PCR in cell lines from west and east origin confirmed these differences. Interestingly, two of these genes have been associated to aggressiveness (COL1A1 and KLK10). In conclusion we found that in silico analysis of SAGE libraries from two different ethnicities reveal differences in gene expression profile. These expression differences might contribute to explain the disparate outcome between the West and the East.


Figures

Figure 1
Figure 1
Correspondence Analysis of normal and tumor SAGE libraries of the stomach. A two-dimensional plot is shown where the green dots represent all the normal libraries, the blue dots are the East tumor libraries, and the red, orange and yellow dots are West tumor libraries, microdissected, xenograft and bulk respectively.
Figure 2
Figure 2
Serial Analysis for Microarray of normal and tumor SAGE libraries of the stomach. To the left and shown in green color, the significant tags with higher expression in the normal libraries; to the right and shown in red color, the significant tags with higher expression in the tumor libraries.
Figure 3
Figure 3
Support Tree of normal and tumor SAGE libraries of the stomach. Lanes 1–4 normal libraries (CGAP_MD_13S, GSM784, CGAP_MD_14S, GSM14780), lanes 5–11 West tumor libraries (CGAP_MD_HG7, CGAP_MD_HS29, CGAP_MD_G329, GSM757, GSM758, GSM14760, GSM2385) and lanes 12–14 East tumor libraries (GSM7800, GSM8505, and GSM8867). Only the top of the dendrogram is shown here. The full dendrogram appear in Additional File 3.
Figure 4
Figure 4
Serial Analysis for Microarray of East and West gastric carcinoma SAGE libraries. To the left and shown in orange color, the significant tags with higher expression in the West tumor libraries; to the right and shown in blue color, the significant tags with higher expression in the East tumor libraries.
Figure 5
Figure 5
Expression levels of COL1A1 associated tag (TGGAAATGAC) in tumor libraries. Bars 1–7 correspond to all West tumor libraries (CGAP_MD_HG7, CGAP_MD_HS29, CGAP_MD_G329, GSM757, GSM758, GSM14760, GSM2385 and bars 8–10 correspond to all East tumor libraries (GSM7800, GSM8505, GSM8867). The tag normalized expression level appears in the CGAP format value (Tags per 200,000) plotted in a logarithmic scale.
Figure 6
Figure 6
Amplification of PDGFRA (A) and RPL13 (B) mRNA by qRT-PCR. In (A) blue line is the East cell line (MKN45) and red line is the West cell line (N87). In (B) blue line is the East cell line (MKN45) and red line is the West cell line (AGS). Both genes are over-expressed in the East (MKN45) cell line.

References

    1. Crew KD, Neugut AI. Epidemiology of gastric cancer. World J Gastroenterol. 2006;12:354–362. - PMC - PubMed
    1. Pisani P, Bray F, Parkin DM. Estimates of the world-wide prevalence of cancer for 25 sites in the adult population. Int J Cancer. 2002;97:72–81. doi: 10.1002/ijc.1571. - DOI - PubMed
    1. Parkin DM. International variation. Oncogene. 2004;23:6329–6340. doi: 10.1038/sj.onc.1207726. - DOI - PubMed
    1. Theuer CP, Kurosaki T, Ziogas A, Butler J, Anton-Culver H. Asian patients with gastric carcinoma in the United States exhibit unique clinical features and superior overall and cancer specific survival rates. Cancer. 2000;89:1883–1892. doi: 10.1002/1097-0142(20001101)89:9<1883::AID-CNCR3>3.3.CO;2-8. - DOI - PubMed
    1. Theuer CP. Ethnicity-related gastric cancer survival. J Clin Oncol. 2003;21:4253; author reply 4253. doi: 10.1200/JCO.2003.99.141. - DOI - PubMed

Publication types

MeSH terms