. 2008 Feb;6(2):e34.
doi: 10.1371/journal.pbio.0060034.

Caldendrin-Jacob: a protein liaison that couples NMDA receptor signalling to the nucleus

Affiliations

Caldendrin-Jacob: a protein liaison that couples NMDA receptor signalling to the nucleus

Daniela C Dieterich et al. PLoS Biol. 2008 Feb.

Erratum in

  • PLoS Biol. 2009 Jan;7(1):e1000022

Abstract

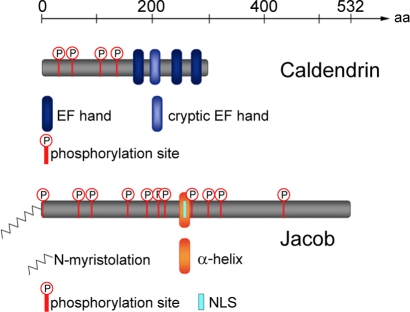
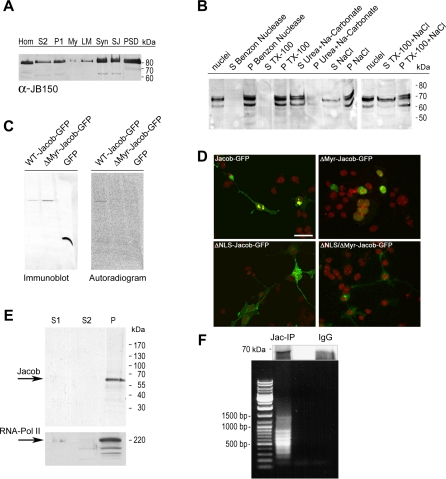
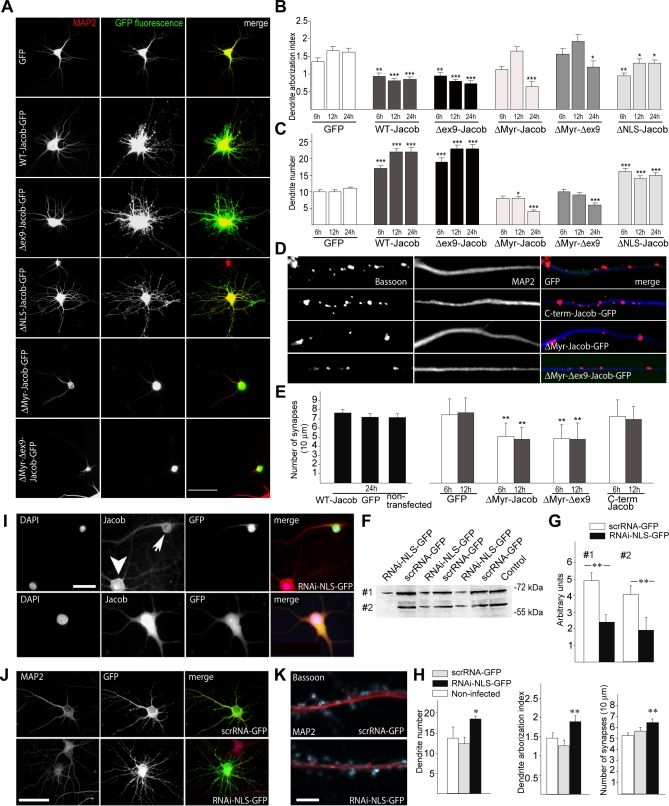
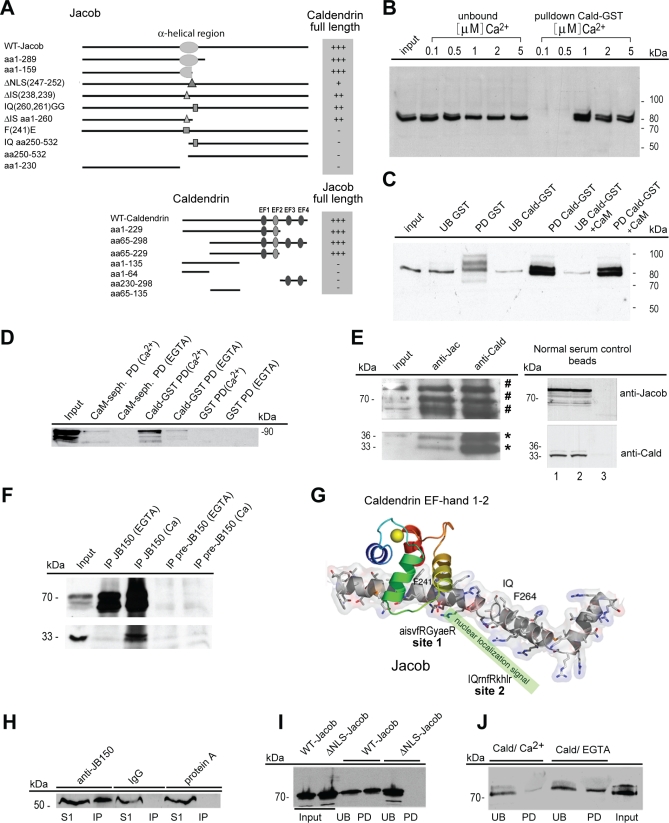
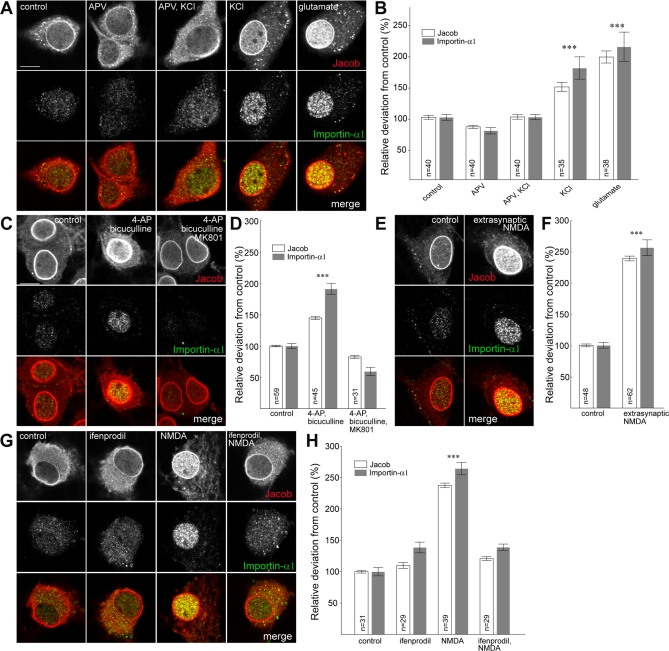
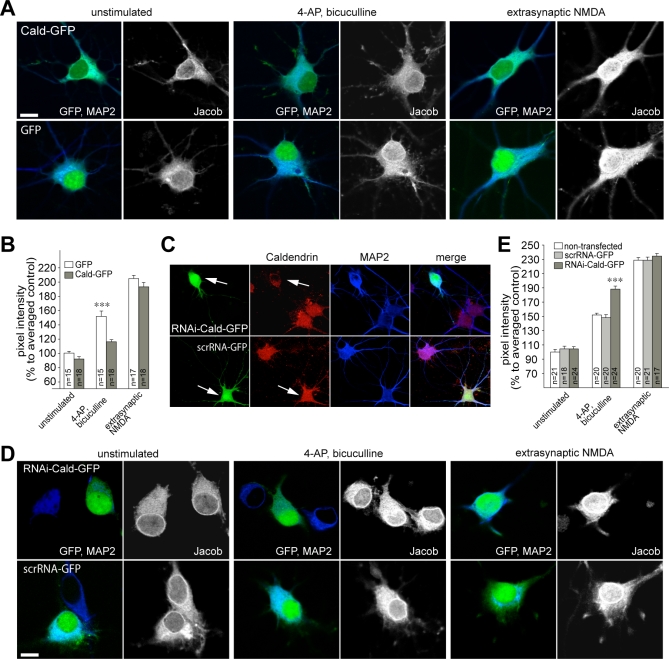
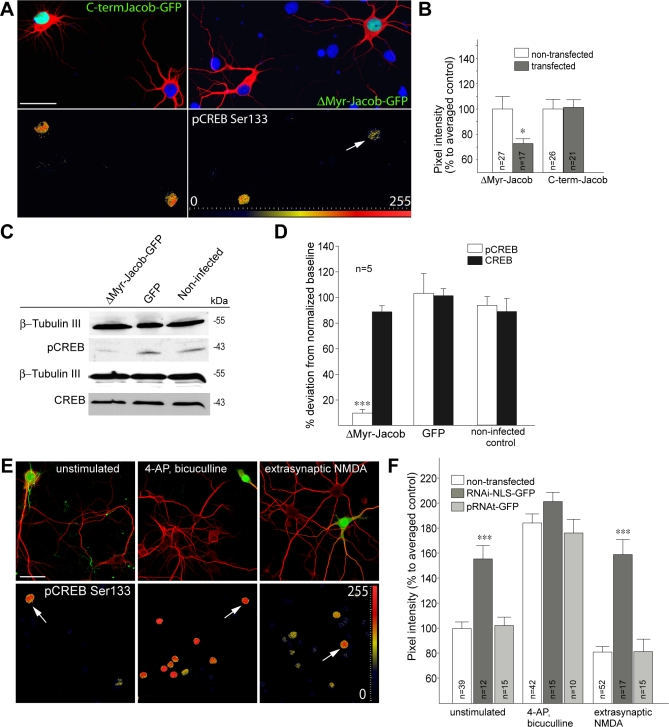
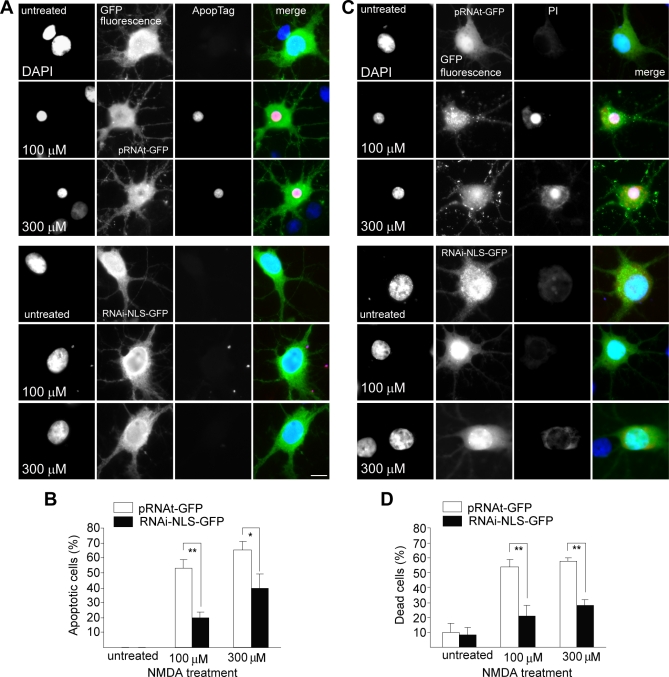
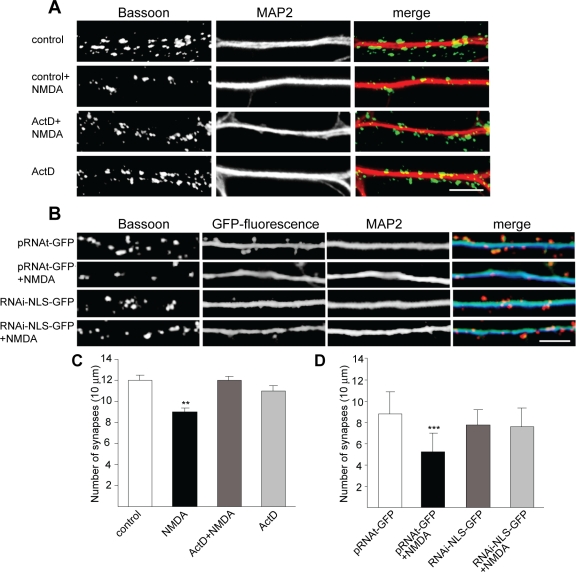
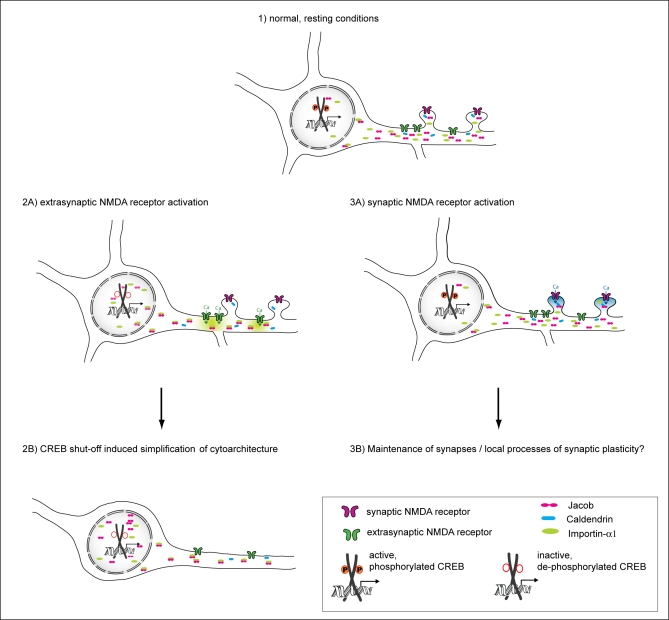
NMDA (N-methyl-D-aspartate) receptors and calcium can exert multiple and very divergent effects within neuronal cells, thereby impacting opposing occurrences such as synaptic plasticity and neuronal degeneration. The neuronal Ca2+ sensor Caldendrin is a postsynaptic density component with high similarity to calmodulin. Jacob, a recently identified Caldendrin binding partner, is a novel protein abundantly expressed in limbic brain and cerebral cortex. Strictly depending upon activation of NMDA-type glutamate receptors, Jacob is recruited to neuronal nuclei, resulting in a rapid stripping of synaptic contacts and in a drastically altered morphology of the dendritic tree. Jacob's nuclear trafficking from distal dendrites crucially requires the classical Importin pathway. Caldendrin binds to Jacob's nuclear localization signal in a Ca2+-dependent manner, thereby controlling Jacob's extranuclear localization by competing with the binding of Importin-alpha to Jacob's nuclear localization signal. This competition requires sustained synapto-dendritic Ca2+ levels, which presumably cannot be achieved by activation of extrasynaptic NMDA receptors, but are confined to Ca2+ microdomains such as postsynaptic spines. Extrasynaptic NMDA receptors, as opposed to their synaptic counterparts, trigger the cAMP response element-binding protein (CREB) shut-off pathway, and cell death. We found that nuclear knockdown of Jacob prevents CREB shut-off after extrasynaptic NMDA receptor activation, whereas its nuclear overexpression induces CREB shut-off without NMDA receptor stimulation. Importantly, nuclear knockdown of Jacob attenuates NMDA-induced loss of synaptic contacts, and neuronal degeneration. This defines a novel mechanism of synapse-to-nucleus communication via a synaptic Ca2+-sensor protein, which links the activity of NMDA receptors to nuclear signalling events involved in modelling synapto-dendritic input and NMDA receptor-induced cellular degeneration.


Conflict of interest statement

Competing interests. The authors have declared that no competing interests exist.

Figures

Figure 1
Figure 1. Primary Structures of Caldendrin and Jacob
Schematic representation of Caldendrin (top) and Jacob (bottom) as predicted from their cDNA sequences. The main sequence features including potential phosphorylation sites, EF-hand structures, N-myristoylation, bipartite NLS, and central α-helical region are depicted.
Figure 2
Figure 2. Immunolocalization of Jacob in Rat Brain
(A) Low-magnification photograph of a rat brain coronal section through the forebrain (corresponding to Figure 31 in the rat stereotaxic atlas by Paxinos and Watson [64]) showing the distribution of Jacob IR. Immunostaining is particularly prominent in the hippocampus (Hip), the cerebral cortex (Cx), amygdala (Amg), and in nuclei of thalamus (Th) and hypothalamus (Hyp). (B and C) Apart from a fine neuropil staining, soma and apical dendrites (arrows) of pyramidal cells in the layer V of the cerebral cortex are strongly labelled. (D–H) Electron micrographs of the parietal cortex. (D) At the ultrastructural level, a patch-like distribution of the reaction product (arrowheads) is detectable in nuclei near the nuclear envelope and throughout the karyoplasm of cortical neurons. (E) Also in dendrites (d) of pyramidal cells, Jacob IR is not evenly distributed. Arrowheads mark patches of the immunoproduct. (G) Two profiles of immunopositive dendrites (d), which receive synaptic inputs (presynapses are marked by asterisks). In the larger dendrite, the reaction product is not concentrated towards the synaptic structures. (F and H) Examples of Jacob immunopositive spine synapses with labelled postsynaptic elements (in [H] in close proximity to an immunonegative spine synapse) that occur relatively rarely. Asterisks indicate presynaptic boutons. Preabsorption of the antibody with Jacob fusion protein blocked all immunostaining (unpublished data). Scale bars indicate 2 mm (A), 200 μm (B), 50 μm (C), 0.5 μm (D), 1 μm (E), and 0.25 μm (F–H).
Figure 3
Figure 3. Jacob's Association with Subcellular Structures
(A) Distribution of Jacob IR in subcellular fractions from rat brain. Panels show two different immunoblots of subcellular fractions (20 μg/lane) obtained by differential centrifugation from brains of adult rats visualized with Jacob (upper panel) and SAP90/PSD-95 (lower panel) antibodies. Hom, homogenate; LM, light membranes; My, myelin fraction; P2, crude membranes; PSD, postsynaptic density fraction; S2, 13.000 × g supernatant after removal of cell debris and nuclei; SJ, synaptic junctions; Syn, synaptosomes. (B) Western blots showing the extraction of Jacob from a nuclear protein-enriched fraction; P, remaining pellet after centrifugation; S, extractable supernatant. Nuclei were extracted with the agents indicated. Please note the tight association of Jacob isoforms with the nuclear protein fraction. Same amounts of protein were loaded. The size of marker proteins in kDa is indicated at the right margin. (C) Fractionation of chromatin after partial digestion of nuclei by micrococcal nuclease. P: heterogeneously sized DNA bound to the nuclear scaffold; S1: protein fraction containing mononucleosomal-sized DNA fragments; S2: protein fraction containing a nucleosomal ladder of DNA fragments. Jacob is only present in this fraction, which contains RNA Polymerase II and represents the euchromatin. (D) Chromatin immunoprecipitation of Jacob (Jac-IP) (immunoblot in the upper panel) using the P fraction as starting material leads to the coprecipitation of heterogeneously sized DNA (agarose gel in the lower panel) that is not present in IgG control (IgG). (E) N-myristoylation was examined in wild-type Jacob (WT-Jacob-GFP), myristoylation mutant (DMyr-Jacob-GFP), and GFP-expressing HEK-293 (GFP) cells, which were incubated overnight with [3H] myristic acid. Crude detergent extracts were immunoprecipitated with a polyclonal GFP antibody, subjected to SDS-PAGE, transferred to nitrocellulose, and applied to a PhosphoImager system. Left: immunodetection with a monoclonal GFP antibody; right: autoradiograph. Note the incorporation of radiolabelled myristate into immunoprecipitated WT-Jacob-GFP. Sizes of marker proteins in kDa are indicated at the right margin. (F) Subcellular localization of wild-type (Jacob-GFP), myristoylation mutant (DMyr-Jacob-GFP), NLS mutant (DNLS-Jacob-GFP), and myristoylation-NLS double mutant (DNLS/DMyr-Jacob-GFP) Jacob GFP-chimeras expressed in COS-7 cells for 24 h. For counterstaining of nuclei, cells were embedded in propidium iodide–containing mounting media (red). Very little variability was seen in the subcellular localization of these different constructs (DMyr-Jacob-GFP in 98% of all cases nuclear, whereas DNLS-Jacob-GFP and DNLS/DMyr-Jacob-GFP were in 98% of all cases extranuclear). Scale bar indicates 25 mm.
Figure 4
Figure 4. Morphological Analysis of Primary Neurons after Jacob Overexpression or RNAi Knockdown
(A) Micrographs depicting MAP2/GFP-labeled hippocampal neurons 24 h after transfection with different Jacob constructs. Neurons were transfected at DIV11. Scale bar indicate 30 μm. (B) Quantification of dendritic complexity by determination of the average number of dendritic branch points for each MAP2-immunopositive dendrite (dendrite arborization index/N: 70 cells in each group). An asterisk (*) indicates p < 0.05; double asterisks (**) indicates p < 0.01; and triple asterisks (***) indicates p < 0.001. (C) Quantification of MAP2-immunopositive neurites after overexpression of different Jacob-GFP cDNA constructs and GFP-vector as a control (n = 70 cells in each group). An asterisk (*) indicates p < 0.05; triple asterisks (***) indicates, p < 0.001. (D) Micrographs depicting Bassoon-immunoreactive synaptic puncta on dendrites of hippocampal primary neurons after overexpression of different Jacob cDNA constructs. Scale bar indicates 2 μm. (E) Quantification of synaptic puncta on dendrites of hippocampal primary neurons after overexpression of different Jacob-GFP cDNA constructs. Double asterisks (**) indicate p < 0.01. (F) Immunoblots demonstrating the knockdown of nuclear Jacob isoforms after lentiviral infection of cortical primary neurons. Immunoreactivity is clearly reduced in nuclear-enriched fractions at DIV21 after infection of cultures at DIV0 with an RNAi virus targeted to knockdown specifically the NLS-bearing nuclear isoforms of Jacob (RNAi-NLS-GFP). A scrambled version of the targeting sequence (scrRNA-GFP), however, has no effect. (G) Immunoblot quantification of the knockdown of Jacob nuclear isoforms with the Quantity One software from BioRad. Depicted are three independent experiments. Quantitative immunoblot analysis was done for the upper (#1) and lower band (#2) (n = 5). RNAi-NLS-GFP, RNAi virus-targeted knockdown of NLS-bearing Jacob isoforms. Arbitrary units are presented as mean ± SEM. Double asterisks (**) indicate p < 0.01. (H) Quantification of dendrite number and complexity and the number of synapses in RNAi-NLS-GFP– and scrRNA-GFP–infected neurons (infection at DIV0/pictures taken at DIV21) as compared to noninfected controls. An asterisk (*) indicates p < 0.05; double asterisks (**) indicate p < 0.01. (I) Nuclear Jacob staining (red) is clearly reduced after infection of cortical primary neurons with the lentiviral RNAi-NLS-GFP construct (green; sharp arrow, upper panel) as compared to noninfected cells from the same culture (thick arrow, upper panel) or neurons infected with the scrRNA-GFP construct (lower panel). Blue channel: nuclear DAPI staining. Infection was done at DIV0, fixation at DIV21. Scale bar indicates 10 μm. (J) MAP2/GFP-labelled cortical primary neurons after infection with the lentiviral RNAi-NLS-GFP and the scrRNA-GFP construct (infection: DIV0/fixation: DIV21). Note the morphological phenotype of NLS-Jacob knockdown. Scale bar indicates 30 μm. (K) Bassoon-immunoreactive synaptic puncta (blue) on MAP2-stained (red) dendrites of cortical primary neurons after infection with the lentiviral RNAi-NLS-GFP and the scrRNA-GFP construct. (infection: DIV0/fixation: DIV21). Scale bar indicates 4 μm.
Figure 5
Figure 5. Caldendrin and Importin-a Bind to Jacob in a Competitive Manner
(A) Mapping the Caldendrin–Jacob interaction using the yeast two-hybrid assay. Upper panel: deletion and point mutation constructs of Jacob tested for interaction with full-length Caldendrin. Lower panel: deletion constructs of Caldendrin tested for interaction with full-length Jacob. Yeast two-hybrid interactions were quantified based on the time course of induction of the reporter gene β-galactosidase. Triple plus signs (+++) indicate blue colonies after 1 h; double plus signs (++) indicate blue colonies after 3 h; a plus sign (+) indicates blue colonies after 6 h; a negative sign (–) indicates no signal after 6 h. (B) Interaction of Jacob with GST-tagged Caldendrin (Cald-GST) in a pull-down assay at different Ca2+ concentrations indicated. A Triton X-100–extracted P2 fraction was incubated with glutathione sepharose loaded with a GST fusion protein containing the C-terminal half (aa 137–298) of Caldendrin or with GST alone. pull-down, pellet fraction; unbound, supernatant. (C) Interaction of Jacob with GST-tagged Caldendrin in a competitive pull-down assay with recombinant CaM at 100 μM Ca2+. A Triton X-100–extracted P2 fraction was incubated with glutathione sepharose loaded with a GST-fusion protein containing the C-terminal half (aa 137–298) of Caldendrin or with GST alone in the presence or absence of 40-μg recombinant CaM. PD, pull-down fraction; UB, unbound material. After washing, bound proteins were detected by western blotting using the antibody anti-JB150. (D) WT-Jacob-GFP does not bind to CaM in a pull-down assay. Jacob binding to CaM or Caldendrin-GST sepharose was tested in the presence of 100 μM Ca2+ or 2 mM EGTA. GST sepharose was used as the control. WT-Jacob-GFP was detected by western blotting with a GFP antibody. (E) Co-immunoaffinity purification of Jacob and Caldendrin. Left panel: 15 mg of protein from the 100,000 × g supernatant of a rat brain membrane extract were loaded either to an anti-Jacob affinity column (anti-Jac) or to an anti-Caldendrin affinity column (anti-Cald). Jacob is co-eluted with Caldendrin and vice versa from the corresponding affinity columns. A number sign (#) indicates Jacob-immunoreactive bands and an asterisk (*) Caldendrin-immunoreactive bands. Right panel: no specific binding was seen to normal serum control beads. 1: Deoxycholic acid (DOC) extract from rat brain cortex; 2: nonbinding proteins (flow-through); 3: specifically bound proteins (eluate). (F) Caldendrin coimmunoprecipitates with Jacob from a rat brain extract in a Ca2+-dependent manner. Rabbit anti-Jacob bound to protein A sepharose specifically precipitates Jacob independent from the conditions used (5 mM of EGTA or 100 μM Ca2+ in the precipitation buffer). Rabbit IgG is used as a negative control (upper panel). Caldendrin was only detected in the precipitate under Ca2+ conditions (lower panel). (G) Molecular modelling of the Caldendrin–Jacob interaction. Caldendrin binds Ca2+-dependently to the first incomplete IQ motif, and blocks the NLS. As indicated, Jacob contains two incomplete IQ motifs. The matching residues are marked in bold. The helical structure has been modelled using the coordinates of Myosin I (pdb: 1wdc), showing that Jacob has a similar CaM site distribution as the template structure. In contrast to myosin I/CaM, Caldendrin binds to site 1 in a complex more closely related to the compact CaMKII/CaM complex. This is in agreement with Caldendrin's binding at high Ca2+ concentration, whereas IQ motif proteins bind independently of Ca2+ concentrations. Crucial residues for the interaction are indicated. (H) Immunoprecipitation of Importin-α1 from a soluble rat brain protein fraction with a Protein-A sepharose-coupled Jacob antibody (JB-150). Importin-α1 was only found in the immunoprecipitate (IP) of the Protein-A sepharose coupled Jacob-antibody, whereas it remained in the prewashing supernatant (S1) in the IgG and Protein-A sepharose control. (I) GST-Importin-α1 pull-down of myc/his-tagged WT and DNLS-Jacob extracted from transfected HEK-293 cells. Only WT Jacob, but not DNLS-Jacob, is found in the pull-down, indicating that the presence of the NLS is essential for the Importin-α1/Jacob interaction. PD, pull-down fraction; UB, unbound material. (J) GST-Importin-α1 pull-down of myc/his-tagged WT Jacob in the presence of equimolar amounts of Caldendrin. Pull-down of Jacob is attenuated in the presence of 2 mM Ca2+, but not in the presence of 2 mM EGTA. PD, pull-down fraction; UB, unbound material.
Figure 6
Figure 6. Time-Lapse Imaging of Jacob's Nuclear Translocation
(A) Confocal maximal intensity image of a living hippocampal primary cultured neuron (DIV10) overexpressing WT-Jacob-GFP (green channel) and merged with a nuclear stain (DAPI) obtained after the experiment (red channel). (B) Representative selective video frames obtained from a WT-Jacob-GFP overexpressing neuron before (0) and after (from left to right) glutamate stimulation at time points indicated. DIC, difference interference contrast image of the neuronal soma. (C) Averaged temporal dynamics of the changes in WT-Jacob-GFP fluorescence intensity, quantified using ImageJ software in distinct regions of interest before and after stimulation with glutamate (50 μM). The arrow indicates the time point of glutamate application. The increase in WT-Jacob-GFP fluorescence in the soma and nuclei is accompanied by a reduction of fluorescence intensity in the dendrites. Statistically significant differences in GFP fluorescence in neuronal nuclei, somata and dendrites after stimulation in comparison to baseline fluorescence are indicated; double asterisks (**) indicate p < 0.01; and triple asterisks (***) indicate p < 0.001. (D) Without glutamate stimulation, no significant changes in WT-Jacob-GFP fluorescence in the nucleus as well as in soma and dendrites were observed. (E) Overexpression of the deletion mutant ΔNLS-Jacob-GFP leads to an extranuclear localisation of the mutant protein. Representative selective video frames obtained from ΔNLS-Jacob-GFP overexpressing neuron before (0) and after (from left to right) glutamate stimulation at time points indicated. DIC, difference interference contrast image of the neuronal soma. (F) Application of glutamate in ΔNLS-Jacob-GFP–transfected neurons does not change the GFP fluorescence levels in dendrites, soma, and nucleus. Scale bars indicate 40 μm in (A) and 25 μm in (B) and (E).
Figure 7
Figure 7. Nuclear Immunoreactivity of Jacob and Importin-α1 upon Different Stimulation Protocols
Depicted are confocal images obtained from a single nuclear focal plane. Scale bar indicates 10 μm. All experiments were done in the presence of 7.5 μM anisomycin. Nuclear Jacob and Importin IR were quantified using the Image J software. The region of interest was outlined from DAPI stainings, and nuclear Jacob and Importin-α1 IR were measured as mean grey value (in arbitrary units of pixel intensity) from Z-stacks of two to three nuclear planes, and differences between groups were calculated as relative deviations from control. The nuclear membrane was excluded from the analysis. (A and B) Depolarization of hippocampal primary neurons (DIV16) for 3 min with 50 μM glutamate or 55 mM KCl in the presence or absence of the competitive NMDA receptor antagonist DL-APV (20 μM). Cultures were fixed 30 min after stimulation. Triple asterisks (***) indicate p < 0.001. (C and D) Synaptic stimulation of hippocampal primary neurons (DIV16) for 30 min with bicuculline (50 μM) and 4-AP (2.5 mM) in the presence or absence of the noncompetitive NMDA receptor antagonist MK801 (5 μM). Cultures were fixed 30 min after the stimulation with bicuculline started. Triple asterisks (***) indicate p < 0.001. (E and F) Extrasynaptic stimulation of hippocampal primary neurons (DIV16) with bath application of NMDA (100 μM for 3 min) following irreversible block of synaptic NMDA receptors. Cultures were fixed 30 min after NMDA stimulation. Triple asterisks (***) indicate p < 0.001. (G and H) Blockage of nuclear Jacob and Importin-α1 trafficking after bath application of NMDA (100 μM for 3 min) in the presence of the NR2B antagonist ifenprodil (5 μM). Cultures were fixed 30 min after NMDA stimulation. Triple asterisks (***) indicate p < 0.001.
Figure 8
Figure 8. Caldendrin Targets Jacob Outside the Nucleus
(A) Nuclear Jacob immunofluorescence following Caldendrin overexpression (upper panel) and in GFP control transfections (lower panel). Depicted are unstimulated neurons (first two rows), neurons 30 min after bicuculline stimulation (rows three and four), and neurons after stimulation of extrasynaptic NMDA receptors (rows five and six). Transfections were done at DIV13, stimulation experiments at DIV16. Scale bar indicates 10 μm (B) Quantitative analysis of nuclear Jacob immunofluorescence as percent deviation from unstimulated GFP control transfections. Triple asterisks (***) indicate p < 0.001. Data are presented as mean ± SEM. (C) Caldendrin staining (red) is clearly reduced after transfection of hippocampal primary neurons with a RNAi-GFP construct (GFP-positive cells are indicated with arrows, upper panel) as compared to nontransfected cells from the same culture or neurons infected with the scrRNA-GFP construct (see arrow in the lower panel). Blue channel: MAP2 staining. Transfection was done at DIV10, fixation at DIV16. Scale bar indicates 10 μm. (D) Synaptic and extrasynaptic stimulation of hippocampal primary neurons (DIV16). Cultures were transfected with a Caldendrin RNAi-GFP construct (upper panel) and the scrambled scrRNA-GFP construct (lower panel). Depicted are a transfected and a nontransfected neuron. Cultures were fixed immediately after the stimulation with bicuculline. Extrasynaptic stimulation of hippocampal primary neurons (DIV16) was done with the bath application of NMDA following the irreversible block of synaptic NMDA receptors. (E) Quantitative analysis of nuclear Jacob immunofluorescence after Caldendrin knockdown (RNAi-Cald-GFP), in scrambled controls (scrRNA-GFP) or non-transfected cells as percent deviation from unstimulated controls. Triple asterisks (***) indicate p < 0.001. Data are presented as mean ± SEM.
Figure 9
Figure 9. Nuclear Jacob Regulates the Phosphorylation of CREB
Primary hippocampal neurons were transfected at DIV11, fixed the next day, and stained with MAP2-specific antibodies (Cy5), pCREB (Ser133; Alexa568), and mounted with DAPI-containing (blue) medium. Gradient lookup tables applied to determine the dynamic range of pCREB are included to visualize pixel intensity differences as indicated with the scale from 0 to 255. Scale bar indicates 40 μm. (A and B) Overexpression of ΔMyr-Jacob-GFP decreases the basal level of CREB phosphorylation in nonstimulated primary hippocampal cultures (DIV12). No effect as compared to nontransfected control neurons was seen after the transfection of a Jacob-GFP construct encoding the C-terminal half of Jacob. Quantification is shown in (B). A single asterisk (*) indicates p < 0.01. (C and D) Overexpression of ΔMyr-Jacob-EGFP using a Semliki Forest virus vector significantly reduced the level of pCREB at resting conditions in comparison to EGFP-infected and noninfected cortical primary neurons. The diagram (D) represents the data from four to five independent experiments normalized to β-Tubulin III. Total CREB levels were not affected by infection of the cultures. (E and F) Knockdown of nuclear Jacob utilizing the construct RNAi-NLS-GFP increases basal pCREB levels and prevents CREB shut-off after stimulation of extrasynaptic NMDA receptors. Prior to bath application of NMDA, cultures were stimulated with bicuculline in the presence of MK801. Arrows indicate RNAi-NLS-GFP–transfected neurons. Cultures were fixed 30 min after the stimulation with either bicuculline or the subsequent bath application with NMDA. Triple asterisks (***) indicate p < 0.001.
Figure 10
Figure 10. Nuclear Knockdown of Jacob Prevents NMDA-Induced Cell Death
Primary hippocampal neurons transfected with the construct RNAi-NLS-GFP (DIV8) or with the corresponding pRNAt-GFP scrambled control vector were treated with 100 μM NMDA for 3 min or with 300 μM NMDA for 5 min at DIV15. Cell viability was assessed by fluorescence microscopy after nuclear staining with DAPI (blue in merge). Either incorporation of digoxigenin dNTPs as detected by using anti-digoxigenin–conjugated rhodamine antibody staining (red in merge; [A and B]) was used to quantify apoptosis (ApopTag), or propidium iodide staining (PI; red in merge; [C and D]) were employed as readouts indicating cellular degeneration. Cell viability was determined as the ratio of dead cells to the total number of transfected neurons. A single asterisk (*) indicates p < 0.1; double asterisks (**) indicate p < 0.01.
Figure 11
Figure 11. Nuclear Knockdown of Jacob Prevents NMDA-Induced Stripping of Synaptic Contacts
(A and C) Untransfected primary hippocampal neurons (DIV13) were treated with 50 mM NMDA (bath application for 3 min), actinomycin D (ActD), or both. Cultures were fixed 4 h later and immunostained with anti-MAP2 and Bassoon antibodies to visualize dendritic processes (red in merge) and synapses (green in merge). Scale bar indicates 5 μm (A). Synapse density was quantified in (C). Double asterisks (**) indicate p < 0.01; triple asterisks (***) indicate p < 0.001. (B and D) Primary hippocampal neurons were transfected at DIV8 with a nuclear Jacob RNAi-NLS-GFP knockdown construct or scrambled pRNAt vector. At DIV13, cells were treated with NMDA or saline, and the number of synaptic puncta was quantified (D). Please note that transfection conditions are different than lentiviral infection in Figure 4H. At later time points than DIV13, the number of synapses increases after RNAi-NLS-GFP–based knockdown of Jacob as in Figure 4H. Scale bar indicates 5 μm. Double asterisks (**) indicate p < 0.01; triple asterisks (***) indicate p< 0.001.
Figure 12
Figure 12. Model of Cellular Consequences of the Caldendrin-Jacob Pathway upon Extrasynaptic versus Synaptic NMDA Receptor Activation
Under resting conditions (1), Jacob is mainly localized to the somatodendritic compartment in either an Importin-α-bound or –unbound state. Elevation of dendritic Ca2+ levels via activation of extrasynaptic NR2B-containing NMDA receptors (2A) causes Importin-α–bound Jacob to shuttle into the nucleus, inducing CREB shut-off and simplification of cytoarchitecture (2B). By contrast, activation of synaptic NMDA receptors gives rise to local high levels of Ca2+, enabling the binding of Caldendrin to Jacob, thereby accounting for its extranuclear localization (3A). Proposed consequences of this Ca2+-dependent Caldendrin–Jacob interaction may include maintenance of synapses and local modulations of synaptic plasticity (3B).

Similar articles

Cited by

References

    1. Deisseroth K, Mermelstein PG, Xia H, Tsien RW. Signalling from synapse to nucleus: the logic behind the mechanisms. Curr Opin Neurobiol. 2003;13:354–365. - PubMed
    1. West AE, Griffith EC, Greenberg ME. Regulation of transcription factors by neuronal activity. Nat Rev Neurosci. 2002;3:921–931. - PubMed
    1. Hardingham GE, Bading H. The yin and yang of NMDA receptor signalling. Trends Neurosci. 2003;26:81–89. - PubMed
    1. Blackstone C, Sheng M. Postsynaptic calcium signalling microdomains in neurons. Front Biosci. 2002;7:872–885. - PubMed
    1. Hardingham GE, Arnold FJ, Bading H. Nuclear calcium signalling controls CREB-mediated gene expression triggered by synaptic activity. Nat Neurosci. 2001;4:261–267. - PubMed

Publication types