Surface-anchored monomeric agonist pMHCs alone trigger TCR with high sensitivity
- PMID: 18303949
- PMCID: PMC2253636
- DOI: 10.1371/journal.pbio.0060043
Surface-anchored monomeric agonist pMHCs alone trigger TCR with high sensitivity
Abstract
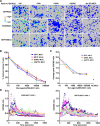
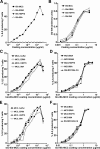
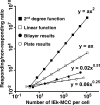
At the interface between T cell and antigen-presenting cell (APC), peptide antigen presented by MHC (pMHC) binds to the T cell receptor (TCR) and initiates signaling. The mechanism of TCR signal initiation, or triggering, remains unclear. An interesting aspect of this puzzle is that although soluble agonist pMHCs cannot trigger TCR even at high concentrations, the same ligands trigger TCR very efficiently on the surface of APCs. Here, using lipid bilayers or plastic-based artificial APCs with defined components, we identify the critical APC-associated factors that confer agonist pMHCs with such potency. We found that CD4+ T cells are triggered by very low numbers of monomeric agonist pMHCs anchored on fluid lipid bilayers or fixed plastic surfaces, in the absence of any other APC surface molecules. Importantly, on bilayers, plastic surfaces, or real APCs, endogenous pMHCs did not enhance TCR triggering. TCR triggering, however, critically depended upon the adhesiveness of the surface and an intact T cell actin cytoskeleton. Based on these observations, we propose the receptor deformation model of TCR triggering to explain the remarkable sensitivity and specificity of TCR triggering.
Conflict of interest statement
Figures


Similar articles
-
DNA origami demonstrate the unique stimulatory power of single pMHCs as T cell antigens.Proc Natl Acad Sci U S A. 2021 Jan 26;118(4):e2016857118. doi: 10.1073/pnas.2016857118. Proc Natl Acad Sci U S A. 2021. PMID: 33468643 Free PMC article.
-
The receptor deformation model of TCR triggering.FASEB J. 2008 Apr;22(4):1002-8. doi: 10.1096/fj.07-9331hyp. Epub 2007 Nov 5. FASEB J. 2008. PMID: 17984179 Free PMC article.
-
T-cell receptor triggering is critically dependent on the dimensions of its peptide-MHC ligand.Nature. 2005 Jul 28;436(7050):578-82. doi: 10.1038/nature03843. Nature. 2005. PMID: 16049493
-
T cell triggering: insights from 2D kinetics analysis of molecular interactions.Phys Biol. 2012 Aug;9(4):045005. doi: 10.1088/1478-3975/9/4/045005. Epub 2012 Aug 7. Phys Biol. 2012. PMID: 22871794 Review.
-
Insights from in situ analysis of TCR-pMHC recognition: response of an interaction network.Immunol Rev. 2013 Jan;251(1):49-64. doi: 10.1111/imr.12016. Immunol Rev. 2013. PMID: 23278740 Free PMC article. Review.
Cited by
-
F-actin flow drives affinity maturation and spatial organization of LFA-1 at the immunological synapse.J Cell Biol. 2015 Feb 16;208(4):475-91. doi: 10.1083/jcb.201406121. Epub 2015 Feb 9. J Cell Biol. 2015. PMID: 25666810 Free PMC article.
-
Mechanical force in T cell receptor signal initiation.Front Immunol. 2012 Jul 20;3:217. doi: 10.3389/fimmu.2012.00217. eCollection 2012. Front Immunol. 2012. PMID: 22833746 Free PMC article. No abstract available.
-
Modulation of antigen discrimination by duration of immune contacts in a kinetic proofreading model of T cell activation with extreme statistics.PLoS Comput Biol. 2023 Aug 30;19(8):e1011216. doi: 10.1371/journal.pcbi.1011216. eCollection 2023 Aug. PLoS Comput Biol. 2023. PMID: 37647345 Free PMC article.
-
Staphylococcal enterotoxin A induces small clusters of HLA-DR1 on B cells.PLoS One. 2009 Jul 9;4(7):e6188. doi: 10.1371/journal.pone.0006188. PLoS One. 2009. PMID: 19587800 Free PMC article.
-
TCR triggering by pMHC ligands tethered on surfaces via poly(ethylene glycol) depends on polymer length.PLoS One. 2014 Nov 10;9(11):e112292. doi: 10.1371/journal.pone.0112292. eCollection 2014. PLoS One. 2014. PMID: 25383949 Free PMC article.
References
-
- van der Merwe PA. The TCR triggering puzzle. Immunity. 2001;14:665–668. - PubMed
-
- Delon J, Gregoire C, Malissen B, Darche S, Lemaitre F, et al. CD8 expression allows T cell signaling by monomeric peptide-MHC complexes. Immunity. 1998;9:467–473. - PubMed
-
- Randriamampita C, Boulla G, Revy P, Lemaitre F, Trautmann A. T cell adhesion lowers the threshold for antigen detection. Eur J Immunol. 2003;33:1215–1223. - PubMed
-
- Doucey MA, Legler DF, Faroudi M, Boucheron N, Baumgaertner P, et al. The beta1 and beta3 integrins promote T cell receptor-mediated cytotoxic T lymphocyte activation. J Biol Chem. 2003;278:26983–26991. - PubMed
Publication types
MeSH terms
Substances
Grants and funding
LinkOut - more resources
Full Text Sources
Other Literature Sources
Molecular Biology Databases
Research Materials
Miscellaneous

