Review
. 2008:26:171-203.
doi: 10.1146/annurev.immunol.26.021607.090421.

Evolutionarily conserved amino acids that control TCR-MHC interaction

Affiliations
Review

Evolutionarily conserved amino acids that control TCR-MHC interaction

Philippa Marrack et al. Annu Rev Immunol. 2008.

Abstract

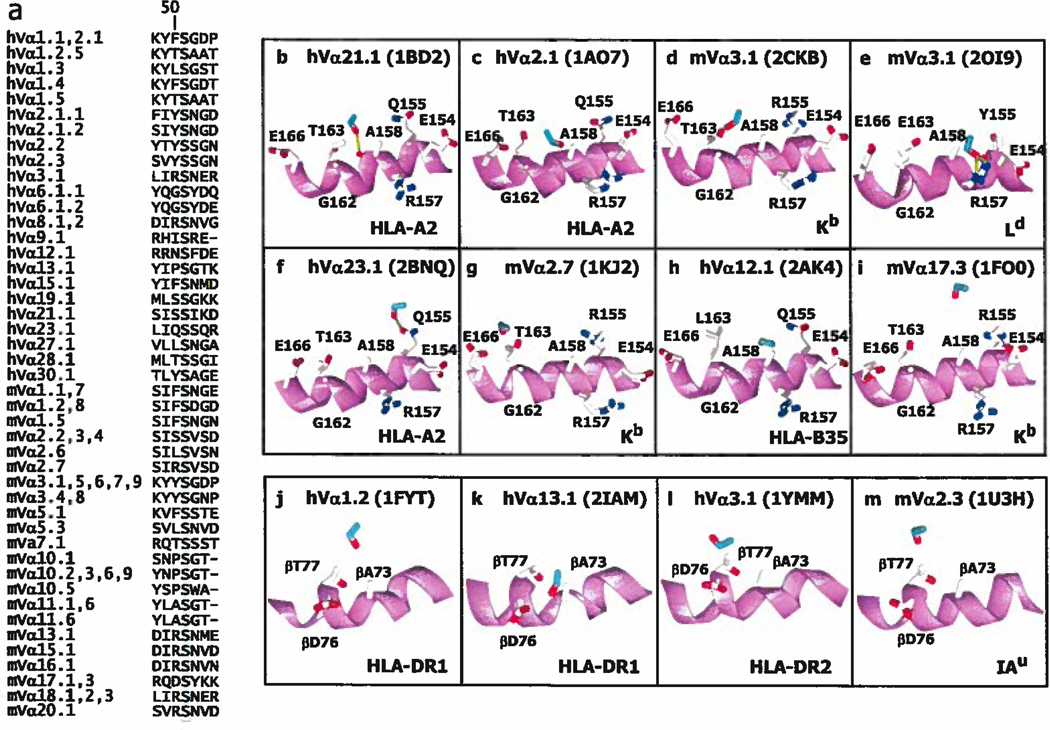
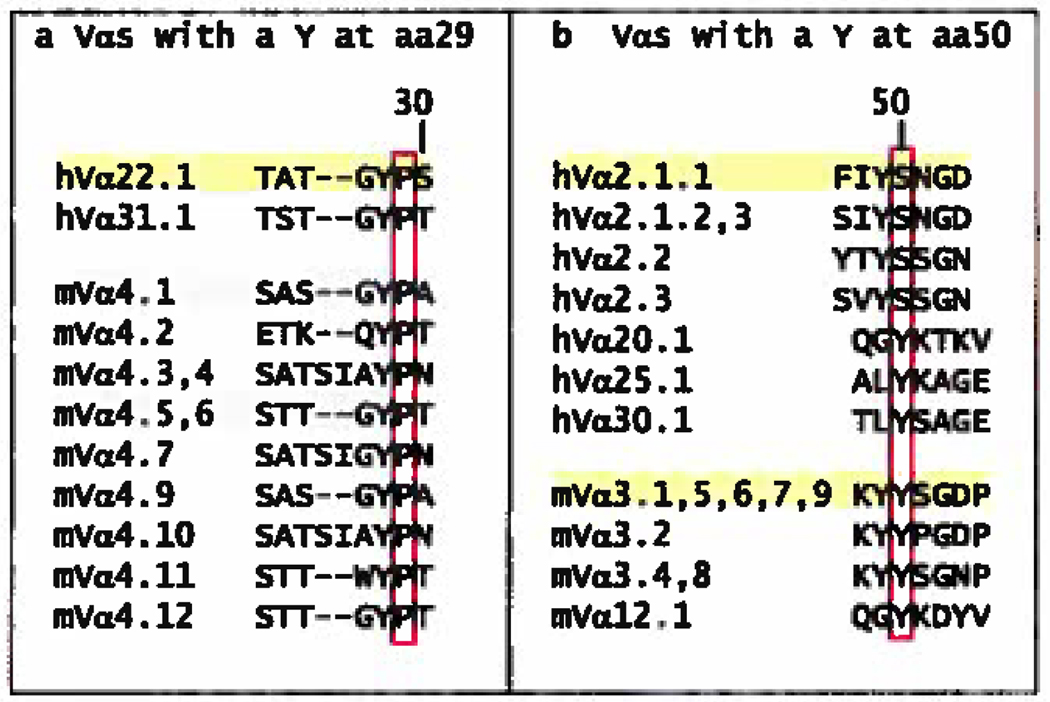
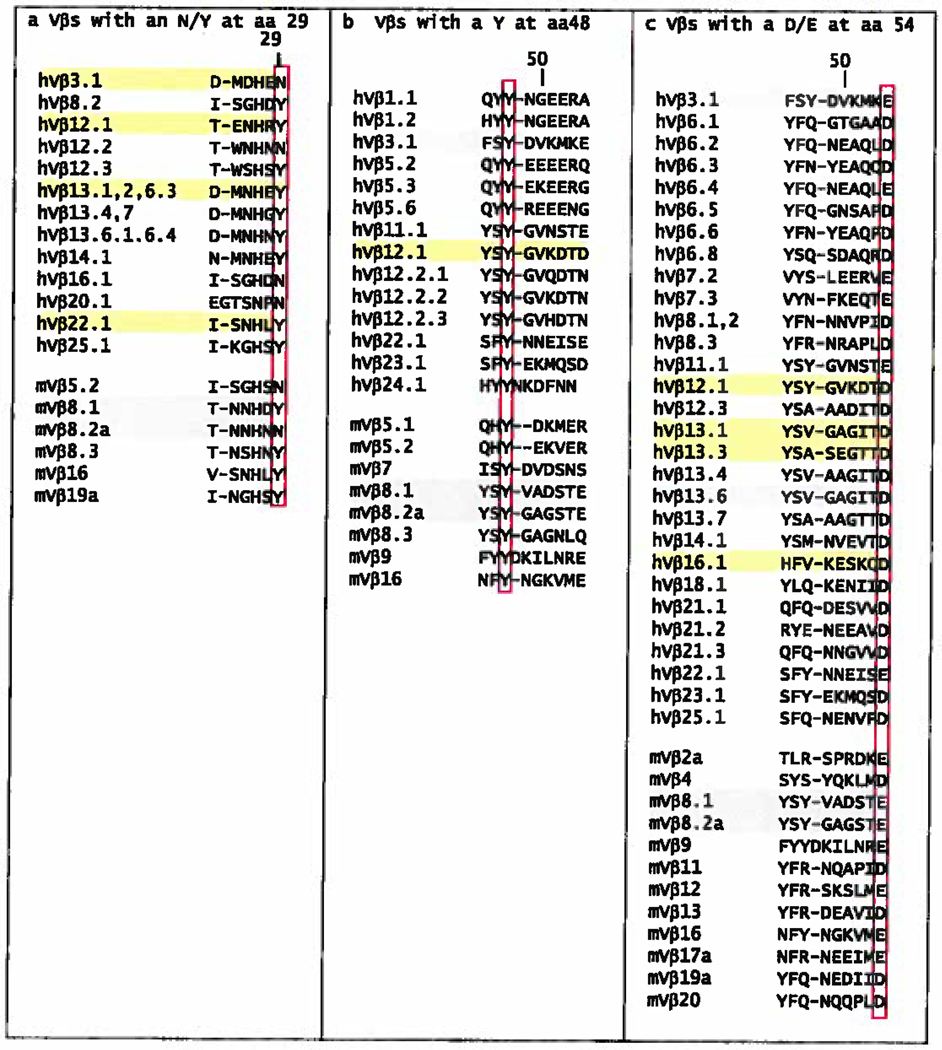
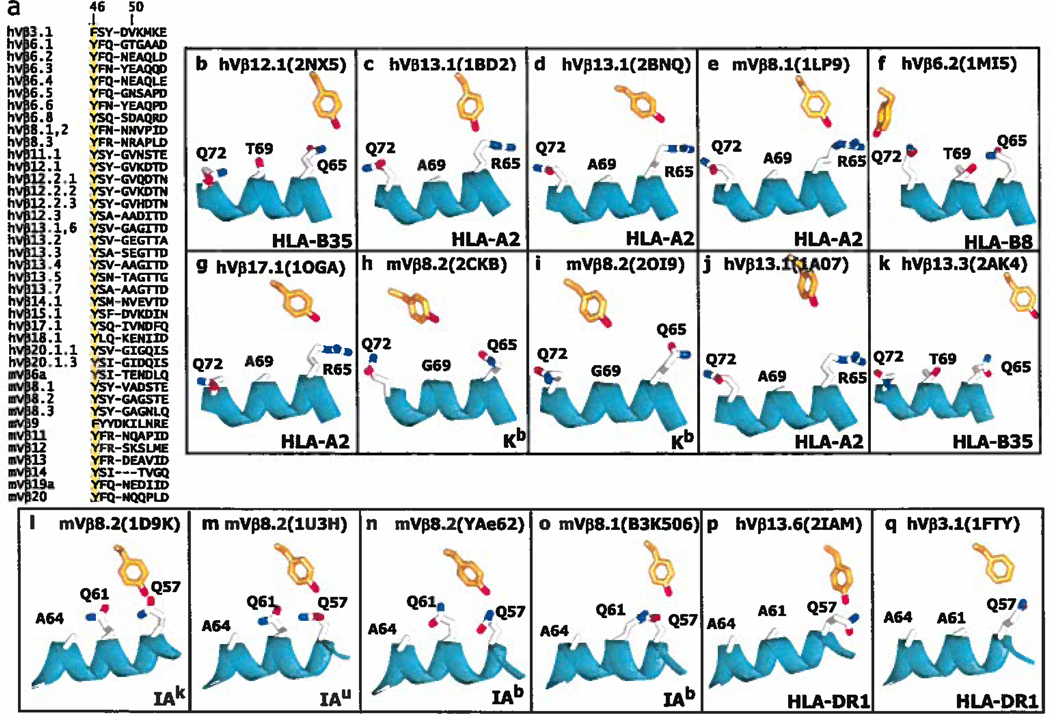
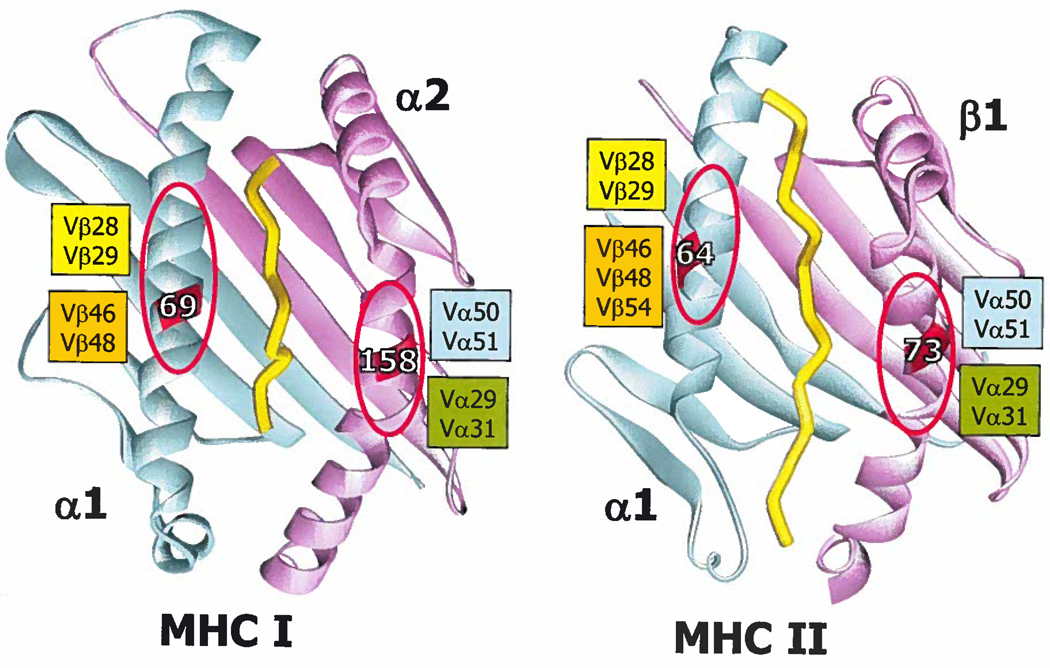
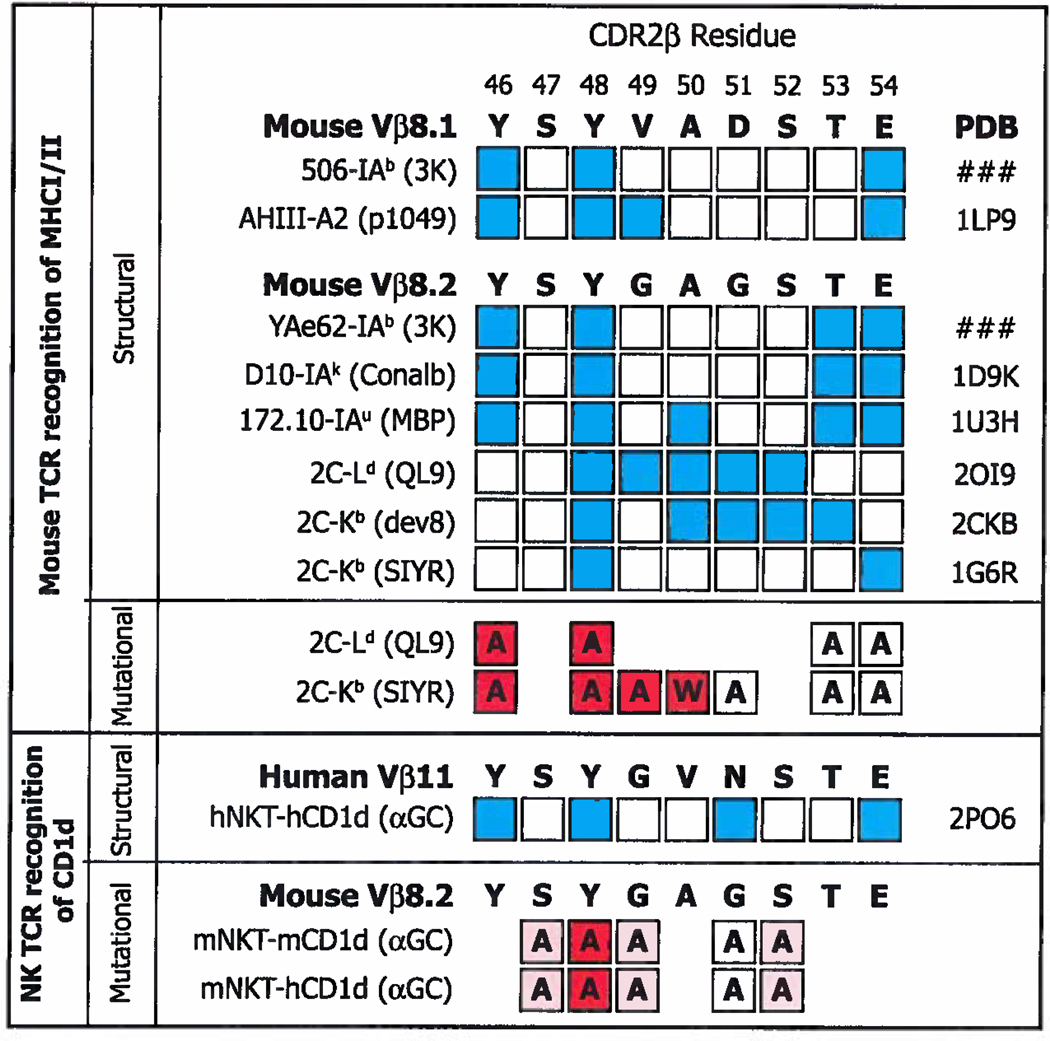
The rules for the conserved reaction of alphabeta T cell receptors (TCRs) with major histocompatibility complex (MHC) proteins plus peptides are poorly understood, probably because thymocytes bearing TCRs with the strongest MHC reactivity are lost by negative selection. Thus, only TCRs with an attenuated ability to react with MHC appear on mature T cells. Also, the interaction sites between TCRs and MHC may be inherently flexible and hence difficult to spot. We reevaluated contacts between TCRs and MHC in the solved structures of their complexes with these points in mind. Relatively conserved amino acids in the TCR complementarity-determining regions (CDR) 1 and CDR2 are often used to bind exposed areas of the MHC alpha-helices. These areas are exposed because of small amino acids that allow somewhat flexible binding of the TCRs. The TCR amino acids involved are specific to families of variable (V) regions and to some extent different rules may govern the recognition of MHCI versus MHCII.


Figures

Figure 1
Figure 1. The TCR usually contacts MHC/peptide on a diagonal, via the loops of its CDR regions
a. Shown is a plan of the contacts between the CDR1–3 loops of the α and β chains of a TCR and a space filling surface of MHC and peptide, exemplified here by a mouse TCR binding to the MHCII protein, IAu, engaged by a peptide from myelin basic protein (pdb 1U3H). The α1/α region of MHC is colored cyan, the α2/β region of MHC is in magenta and the peptide in yellow. The CDR loops are color coded and indicated in their corresponding colors on the diagram. b. As in a, shown in elevation.
Figure 2
Figure 2. Contacts between TCR CDR1 and 2 regions and MHC
a. The figure shows the sequences (bolded) of CDR1α and CDR2α of TCRs whose structure, bound to the MHC/peptide ligands is known. In the same cell as each CDR amino acid are the MHC amino acids (not bolded) bound by that CDR residue, color coded to indicate the MHC region on which they lie. Amino acids from the α1/α regions of MHCI/MHCII are shaded blue, and those from the α2/β regions are shaded pink. Dashes indicate a gap in the CDR region, introduced according to (63, 64) to best align TCR sequences. The sequences are arranged such that TCRs binding MHCI are above, and those binding MHCII are below, in the Figure. Human and mouse TCRs are separated. TCR and MHC amino acids are numbered according to (63, 64). Structures are from (–46) and Dai et al. submitted for publication. b. As in a except that the sequences of TCR CDRβ1 and β2 and their contacts are displayed.
Figure 3
Figure 3. Y/F31 in CDR1α is often used in TCRs and often engages MHC at the same site
a. The Figure lists the CDR1 sequences of the human (h) and mouse (m) Vα regions that contain an F or Y at position 31 (highlighted). V regions were omitted if the sequence of both their CDR1 and CDR2 regions were identical to one already displayed. The numbering of the V regions and their amino acids is according to (63, 64). The sequences were selected from those of 48 human Vαs and 75 mouse Vαs. b–m. Shown are the arrangements of MHC amino acids around Y/F31α (in green with red hydroxyl) in 9 (b–j) of the solved structures of TCRs bound to MHCI with the α2 helix of MHCI in magenta. Also indicated are the Vα region, MHC allele and pdb number. The structures are arranged from left to right and top to bottom roughly according the predicted strength of the interaction between Y/F31α and MHCI, with no predicted contact for Y/F31α in 2AK4 and 1KJ2, at the bottom of the Figure, k–m. Structures are shown as in b–j, but for TCRs bound to MHCII and with the β helix of MHCII in magenta. There is no predicted contact between Y/F31α and MHCII in 1U3H. Structures were selected from the references in Figure 2.
Figure 4
Figure 4. S51 in CDR2α is often used in TCRs and often engages MHC at the same site
a. The Figure lists the CDR2 sequences of the human (h) and mouse (m) Vα regions that contain an S at position 51 (highlighted). V regions were omitted and numbered as in Figure 3a. b–m. Shown are the arrangements of MHC amino acids around S51α (in blue with red hydroxyl) in 8 (b–i) of the solved structures of TCRs bound to MHCI with the α2 helix of MHCI in magenta. Also indicated are the Vα region, MHC allele and pdb number. The structures are arranged from left to right and top to bottom roughly according the predicted strength of the interaction or alignment between S51α and MHCI, with no predicted contact for S51α in 2AK4 and 1FO0. j–m. As in b–i, but for TCRs bound to MHCII and with the β helix of MHCII in magenta. Structures were selected from the references in Figure 2.
Figure 5
Figure 5. CDRα sequences that contain other amino acids that frequently bind MHC at the same position
Listed are the human and mouse V region CDR1α sequences that include a Y at position 29 (a), or the human and mouse V region CDR2α sequences that contain a Y at position 50 (b). The amino acid of interest is in each case boxed in red. The sequences were selected and numbered as in Figure 3a and structures were selected from those in Figure 2.
Figure 6
Figure 6. CDRβ sequences that contain amino acids that frequently bind MHC at the same position
Listed are the human and mouse V region CDR1β sequences that include an N/Y at position 29 (a) or the human and mouse V region CDR2β sequences that contain a Y at position 48 (b) or a D/E at position 54 (c). The sequences were selected from those of 59 human Vβs and 23 mouse Vβs and were numbered as in Figure 3a.
Figure 7
Figure 7. Y/F46 in CDR2β is often used in TCRs and often engages MHC at the same site
a. The Figure lists the CDR2 sequences of the human (h) and mouse (m) Vβ regions that contain a Y/F at position 46 (highlighted). V regions were omitted and numbered as in Figure 3a. b–q. Shown are the arrangements of MHC amino acids around Y46β (in orange with red hydroxyl) in 10 (b–k) of the solved structures of TCRs bound to MHCI with the α1 helix of MHCI in cyan. Also indicated are the Vβ region, MHC allele and pdb number. The structures are arranged from left to right and top to bottom roughly according the predicted strength of the interaction or alignment between S51α and MHCI, with no predicted contact for Y46β in g–k, in the second row of the Figure. l–q. Structures are shown as in b–k, but for TCRs bound to MHCII and with the α helix of MHCII in cyan. Structures were selected from the references in Figure 2.
Figure 8
Figure 8. The amino acids in Vα and Vβ that frequently contact MHC in the same areas can determine the diagonal aspect of TCR binding to MHC
Ribbon representations of HLA-A2/Tax peptide (pdb 1BD2) and IAb/3K (pdb 1LNU) are shown as an examples of an MHCI and MHCII molecule, respectively. The α1/α domains are colored cyan. The MHCI α2 domain and the MHCII β1 domains are colored magenta. The peptide is represented in yellow. The positions of 2 amino acids on the helices of each MHC molecule are labeled, α69 and α158 on MHC1 and α64 and β73 on MHCII. An area of around each of these is indicated with a red oval. TCR amino acids most often found in contact with the MHC within these areas are listed next to each oval. See text for further discussion.
Figure 9
Figure 9. TCRs bind CD1d/glycolipid in an orientation that is completely different from that used to bind classical MHC/peptide
Shown is a plan of the contacts between the CDR1-3 loops of the α and β chains of the hVα24i iTCR and a space filling surface of CD1d and α-galactosylceramide (data taken from (68), pdb2PO6). The α1 region of CD1d is colored cyan, the α2 region of CD1d is in magenta and the glycolipid in yellow. The CDR loops are color coded and indicated in their corresponding colors on the diagram.
Figure 10
Figure 10. Some of the CDR2β amino acids used to contact classical MHCI/MHCII and CD1d are identical
Above. The amino acid sequences of mVβ8.1 and mVβ8.2 in bold. Amino acids that have been shown in sturtures to bind MHC are indicated in blue, together with the names of the TCRs and pdb files used. Amino acids in white squares do not contact MHC in the indicated structure. Below this are shown the results of mutational analyses, in which the amino acid in question was mutated as shown in each square. The influence of each mutation is indicated by particular shades of red, red filled squares indicate >1 log change in reactivity, while white indicates a <0.5 change in log reactivity (122, 123). Below Contact points identified by structural analysis (68) between a hVα24i TCR and hCD1d/αGC and identified by mutational analyses, using staining with CD1d/αGC tetramers, between a mVα14i TCR and mCD1d/αGC or hCD1d/αGC (Scott-Browns et al. submitted for publication). Red filled squares indicate >50% loss in tetramer mean fluorescent intensity (MFI), pink indicates a change between 10% and 50% change in tetramer MFI, while white indicates a <10% change in tetramer MFI.

Similar articles

Cited by

References

    1. Claman HN, Chaperon EA, Triplett RF. Thymus-marrow cell combinations. Synergism in antibody production. Proc Soc Exp Biol Med. 1966;122:1167–1171. - PubMed
    1. Mitchell GF, Miller JF. Cell to cell interaction in the immune response. II. The source of hemolysin-forming cells in irradiated mice given bone marrow and thymus or thoracic duct lymphocytes. J Exp Med. 1968;128:821–837. - PMC - PubMed
    1. Mitchison NA. The carrier effect in the secondary response to hapten-protein conjugates. V. Use of antilymphocyte serum to deplete animals of helper cells. Eur J Immunol. 1971;1:68–75. - PubMed
    1. Rajewsky K. The carrier effect and cellular cooperation in the induction of antibodies. Proc R Soc Lond B Biol Sci. 1971;176:385–392. - PubMed
    1. Gorer PA. Genetic and antigenic basis of tumor transplantation. J. Path. and Bact. 1937;44:691–697.

Publication types

MeSH terms

Substances