Review
. 2008;49 Suppl 3(Suppl 3):42-51.
doi: 10.1111/j.1528-1167.2008.01509.x.

Epileptic networks studied with EEG-fMRI

Affiliations
Review

Epileptic networks studied with EEG-fMRI

Jean Gotman. Epilepsia. 2008.

Abstract

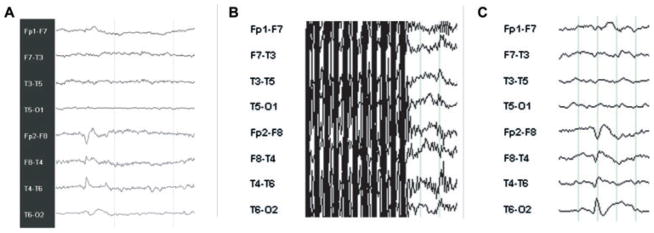
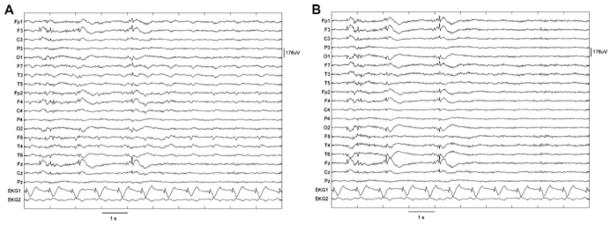
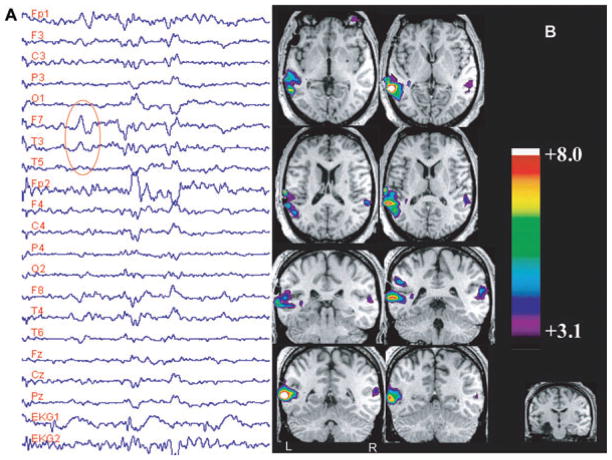
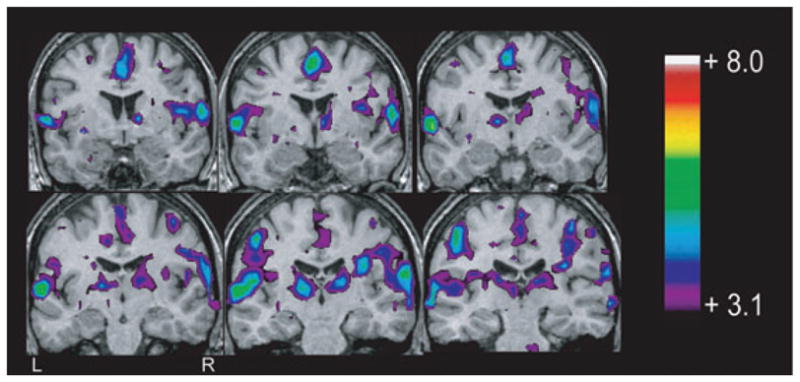
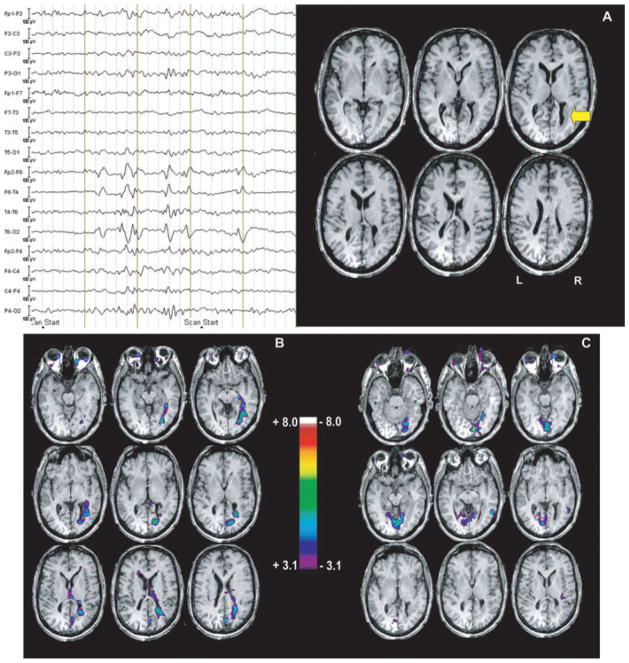
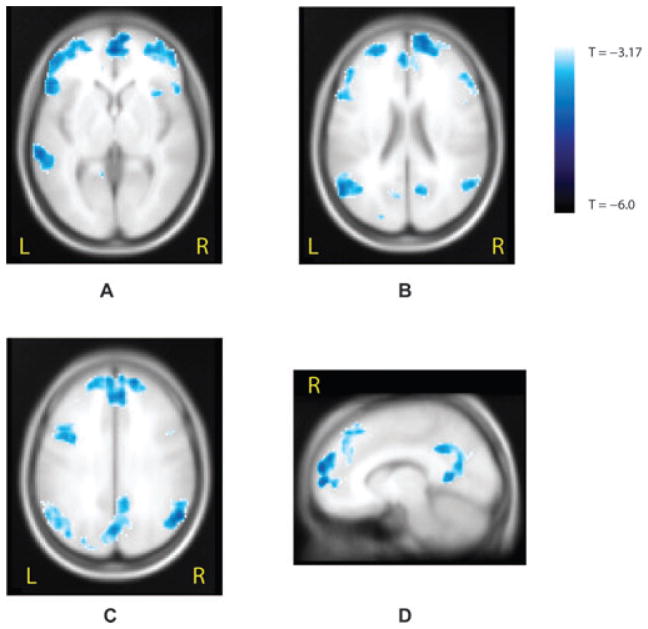
It is not easy to determine the location of the cerebral generators and the other brain regions that may be involved at the time of an epileptic spike seen in the scalp EEG. The possibility to combine EEG recording with functional MRI scanning (fMRI) opens the opportunity to uncover the regions of the brain showing changes in metabolism and blood flow in response to epileptic spikes seen in the EEG. These regions are presumably involved in the abnormal neuronal activity at the origin of epileptic discharges. This paper reviews the methodology involved in performing such studies, including the special techniques required for recording the EEG inside the scanner and the statistical issues in analyzing the fMRI signal. We then discuss the results obtained in patients with different types of focal epileptic disorders and in patients with primary generalized epilepsy. The results in general indicate that interictal epileptic discharges may affect brain areas well beyond the presumed region in which they are generated. The noninvasive nature of this method opens new horizons in the investigation of brain regions involved and affected by epileptic discharges.


Conflict of interest statement

Conflict of interest: The author has no conflict of interest.

Figures

Figure 1
Figure 1
Eight channels bipolar EEG samples to illustrate quality of recordings. (A) Routine EEG with normal electrodes in the EEG laboratory, showing a right temporal spike with equipotentiality at F8-T4. (B) EEG acquired inside the scanner with Ag/AgCl electrodes during the acquisition of EPI sequences, during which EEG activity is not visible. (C) same segment as in B, after removal of the MRI artifact and filter, disclosing a spike similar to that shown in A. Epilepsia © ILAE
Figure 2
Figure 2
Results of ballistocardiogram removal. (A) Original recording. (B) After independent component analysis (ICA) filtering. The epileptic spikes were left intact and ICA filtering essentially eliminated ballistocardiographic activity (from Bénar et al., 2003). Epilepsia © ILAE
Figure 3
Figure 3
EEG–fMRI findings from study 43, in a patient with a remote left amygdalohippocampectomy (bottom right) for left hippocampal atrophy. (A) EEG recorded in the scanner showing left temporal (LT) spikes (F7-T3-T5). The large gradient artifact was filtered, leaving, nevertheless, some transient waveforms. The epileptic discharges of this patient could be identified unambiguously from their morphology and spatial distribution. (B) Posterior LT lobe activation associated with a smaller and less significant activation in the contralateral homologous region. From Kobayashi et al. (2006a). Epilepsia © ILAE
Figure 4
Figure 4
Blood oxygenation level-dependent response to F7-T3 spikes (study 14), in a patient with bilateral amygdala enlargement, showing bilateral frontotemporal activation, maximum in the perisylvian regions and superior temporal gyri. Note also the involvement of other extratemporal areas including the thalami. From Kobayashi et al. (2006a). Epilepsia © ILAE
Figure 5
Figure 5
EEG–fMRI study from a patient with a periventricular nodule located in the right occipital horn (arrow, A), related to right temporal spikes and polyspikes. Activation (B) was observed in the nodule, also involving the mesial aspect of the occipital lobe. Deactivation (C) was seen bilaterally in the mesial occipital regions, but did not coincide with activation. From Kobayashi et al. (2006b). Epilepsia © ILAE
Figure 6
Figure 6
Significant negative blood oxygen level dependent (BOLD) response observed from the group analysis of 15 idiopathic generalized epilepsy (IGE) patients obtained by using hemodynamic response function (HRF) peaking at 9 s, corrected p < 0.05 for spatial extent. (A) Axial view showing bilateral deactivations in mesial and lateral anterior frontal areas and in the left posterior temporal area. (B) Axial view 1 cm higher than A and showing deactivations in frontal regions, in parietal areas, and in the posterior cingulate gyrus. (C) Axial view 2 cm above B and showing the same frontal and parietal clusters. (D) Sagittal view of the right hemisphere 1 cm away from the midline and showing a deactivation within the mesial prefrontal area and the posterior cingulate gyrus (from Gotman et al., 2005). Epilepsia © ILAE

References

    1. Aghakhani Y, Bagshaw AP, Bénar CG, Hawco C, Andermann F, Dubeau F, Gotman J. fMRI activation during spike and wave discharges in idiopathic generalized epilepsy. Brain. 2004;127:1127–1144. - PubMed
    1. Aghakhani Y, Kinay D, Gotman J, Soualmi L, Andermann F, Olivier A, Dubeau F. The role of periventricular nodular heterotopia in epileptogenesis. Brain. 2005;128:641–651. - PubMed
    1. Aguirre GK, Zarahn E, D’esposito M. The variability of human, BOLD hemodynamic responses. Neuroimage. 1998;8:360–369. - PubMed
    1. Al-Asmi A, Bénar CG, Gross DW, Khani YA, Andermann F, Pike B, Dubeau F, Gotman J. fMRI activation in continuous and spike-triggered EEG-fMRI studies of epileptic spikes. Epilepsia. 2003;44:1328–1339. - PubMed
    1. Allen PJ, Polizzi G, Krakow K, Fish DR, Lemieux L. Identification of EEG events in the MR scanner: the problem of pulse artifact and a method for its subtraction. Neuroimage. 1998;8:229–239. - PubMed

Publication types

MeSH terms

Grants and funding