. 2008 Feb 27:9:21.
doi: 10.1186/1471-2156-9-21.

Worldwide distribution of NAT2 diversity: implications for NAT2 evolutionary history

Affiliations

Worldwide distribution of NAT2 diversity: implications for NAT2 evolutionary history

Audrey Sabbagh et al. BMC Genet. .

Abstract

Background: The N-acetyltransferase 2 (NAT2) gene plays a crucial role in the metabolism of many drugs and xenobiotics. As it represents a likely target of population-specific selection pressures, we fully sequenced the NAT2 coding region in 97 Mandenka individuals from Senegal, and compared these sequences to extant data on other African populations. The Mandenka data were further included in a worldwide dataset composed of 41 published population samples (6,727 individuals) from four continental regions that were adequately genotyped for all common NAT2 variants so as to provide further insights into the worldwide haplotype diversity and population structure at NAT2.

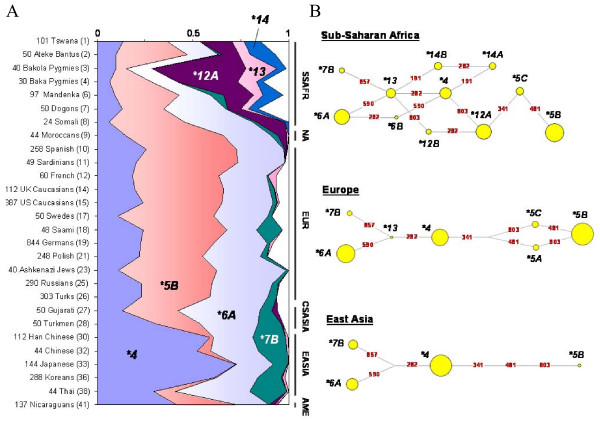
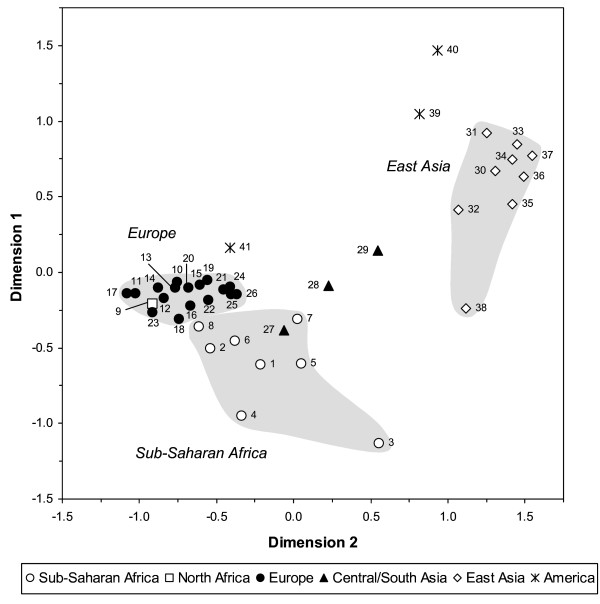
Results: The sequencing analysis of the NAT2 gene in the Mandenka sample revealed twelve polymorphic sites in the coding exon (two of which are newly identified mutations, C345T and C638T), defining 16 haplotypes. High diversity and no molecular signal of departure from neutrality were observed in this West African sample. On the basis of the worldwide genotyping survey dataset, we found a strong genetic structure differentiating East Asians from both Europeans and sub-Saharan Africans. This pattern could result from region- or population-specific selective pressures acting at this locus, as further suggested in the HapMap data by extremely high values of FST for a few SNPs positions in the NAT2 coding exon (T341C, C481T and A803G) in comparison to the empirical distribution of FST values accross the whole 400-kb region of the NAT gene family.

Conclusion: Patterns of sequence variation at NAT2 are consistent with selective neutrality in all sub-Saharan African populations investigated, whereas the high level of population differentiation between Europeans and East Asians inferred from SNPs could suggest population-specific selective pressures acting at this locus, probably caused by differences in diet or exposure to other environmental signals.


Figures

Figure 1
Figure 1
SNP frequencies in the 41 samples of the worldwide genotyping survey. Samples are ordered geographically (as in Additional file 1), thus including: SSAFR, sub-Saharan Africa (Tswana, Ateke Bantus, Bakola Pygmies, Baka Pygmies, Yoruba, Mandenka, Dogons, and Somali); NA, North Africa (Moroccans); EUR, Europe (Spanish, Sardinians, French, French-Canadians, UK Caucasians, both US Caucasian samples, Swedes, Saami, both German samples, Polish, Slovaks, Ashkenazi Jews, Romanians, Russians, and Turks); CSASIA, Central/South Asia (Gujarati, Turkmen, and Kyrgyz); EASIA, East Asia (the three Chinese, three Japanese, and two Korean samples, and Thai); AME, America (Embera, Ngawbe, and Nicaraguans).
Figure 2
Figure 2
(A) Haplotype frequencies in the 28 samples genotyped for all seven common SNPs at NAT2 (i.e., without missing data), taken from the worldwide genotyping survey. Single populations are reported on the left side of the plot, with population codes in brackets; geographic areas are indicated on the right side, as follows: SSAFR, sub-Saharan Africa; NA, North Africa; EUR, Europe; CSASIA, Central/South Asia; EASIA, East Asia; AME, America. Only haplotypes with frequencies > 5% in at least one geographical region were represented individually; all other haplotypes were pooled into a single group (in white). Also, haplotypes NAT2*14A and NAT2*14B were pooled into the NAT2*14 cluster. (B) Median-joining networks of the inferred NAT2 haplotypes within three geographical regions: sub-Saharan Africa, Europe, and East Asia. Only haplotypes with frequencies > 0.005 within a geographic area were considered to construct the networks. Circle areas are proportional to the haplotypes' frequency, and branch lengths are proportional to the number of mutations separating haplotypes. Haplotypes' labels are shown in black; mutations are shown in red on corresponding network branches.
Figure 3
Figure 3
Multidimensional scaling plot of Reynolds genetic distances among the 41 population samples of the worldwide genotyping survey. The stress value is 0.07, indicating a very good fit of the projection to the original data. Samples are numbered according to their population code [see Additional file 1 and Additional file 2]. The shaded areas highlight the distribution of samples from sub-Saharan Africa, Europe, and East Asia in the plot.

Similar articles

Cited by

References

    1. Hein DW. Molecular genetics and function of NAT1 and NAT2: role in aromatic amine metabolism and carcinogenesis. Mutat Res. 2002;506:65–77. - PubMed
    1. Upton A, Johnson N, Sandy J, Sim E. Arylamine N-acetyltransferases – of mice, men and microorganisms. Trends Pharmacol Sci. 2001;22:140–146. doi: 10.1016/S0165-6147(00)01639-4. - DOI - PubMed
    1. Meisel P. Arylamine N-acetyltransferases and drug response. Pharmacogenomics. 2002;3:349–366. doi: 10.1517/14622416.3.3.349. - DOI - PubMed
    1. Butcher NJ, Boukouvala S, Sim E, Minchin RF. Pharmacogenomics J. 2002;2:30–42. doi: 10.1038/sj.tpj.6500053. - DOI - PubMed
    1. Goldstein DB. Pharmacogenetics in the laboratory and the clinic. N Engl J Med. 2003;348:553–556. doi: 10.1056/NEJMe020173. - DOI - PubMed

Publication types

Substances