. 2008 Feb 27:9:102.
doi: 10.1186/1471-2164-9-102.

Protein abundance profiling of the Escherichia coli cytosol

Affiliations

Protein abundance profiling of the Escherichia coli cytosol

Yasushi Ishihama et al. BMC Genomics. .

Abstract

Background: Knowledge about the abundance of molecular components is an important prerequisite for building quantitative predictive models of cellular behavior. Proteins are central components of these models, since they carry out most of the fundamental processes in the cell. Thus far, protein concentrations have been difficult to measure on a large scale, but proteomic technologies have now advanced to a stage where this information becomes readily accessible.

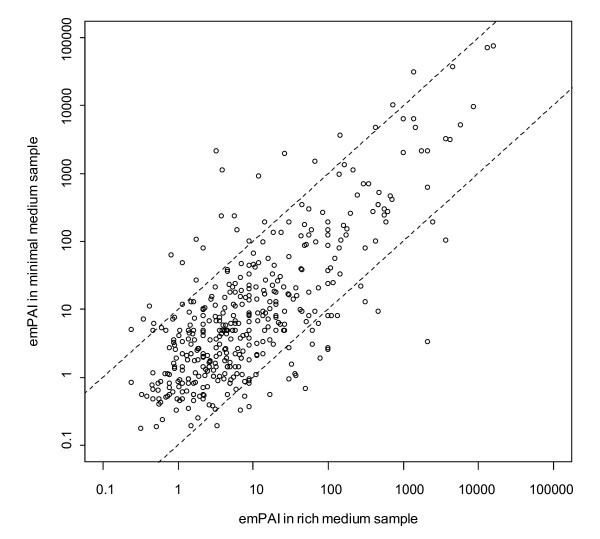
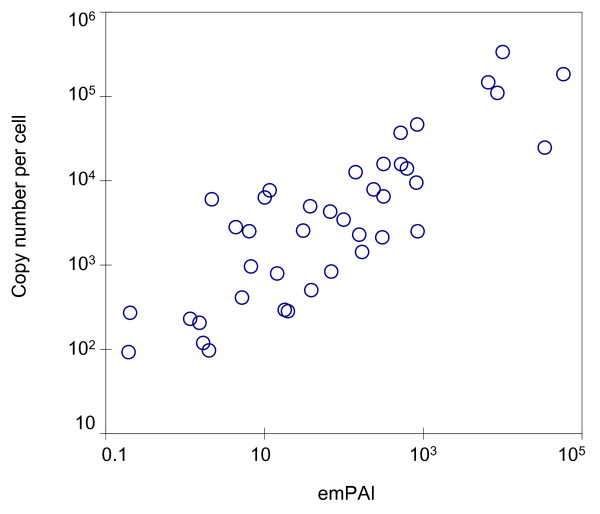
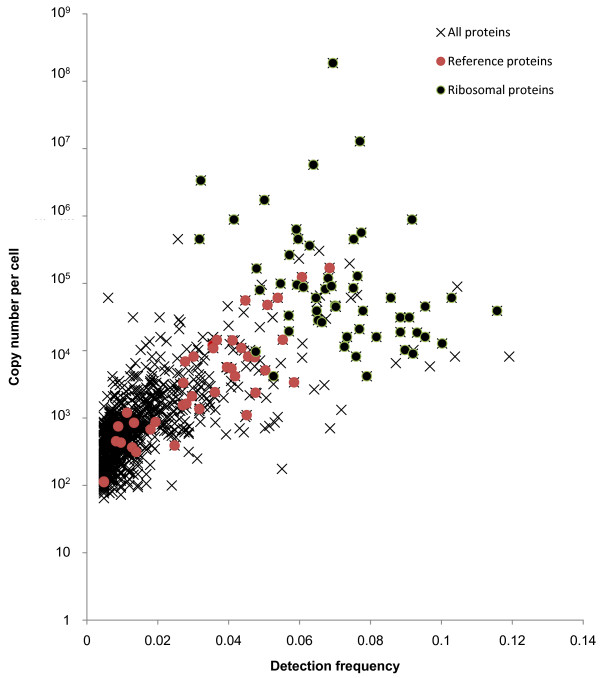
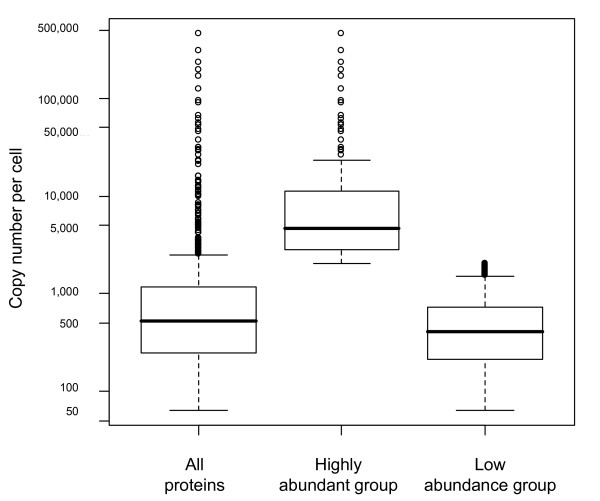
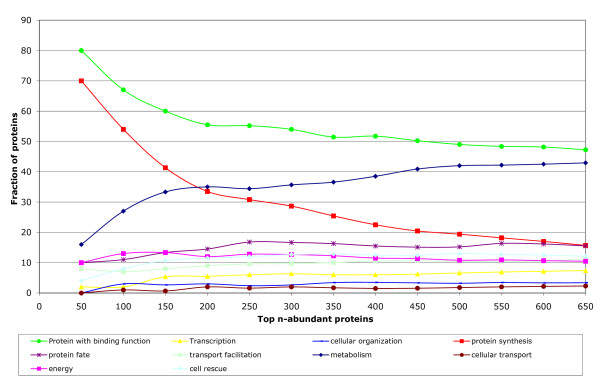
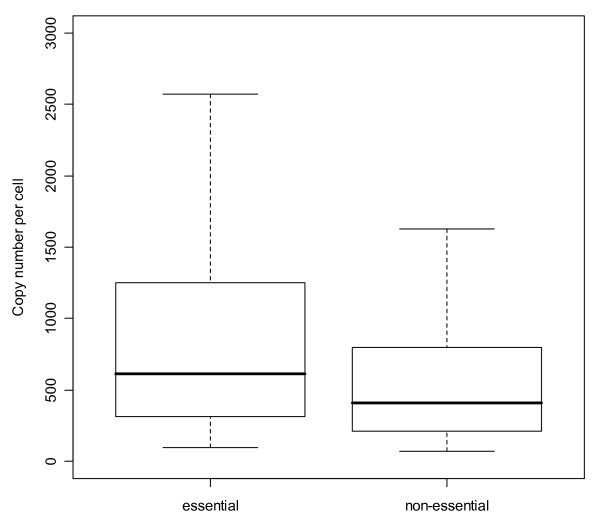
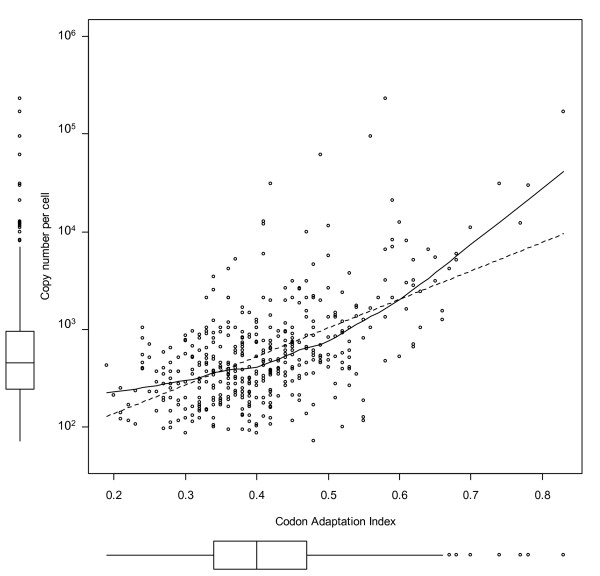
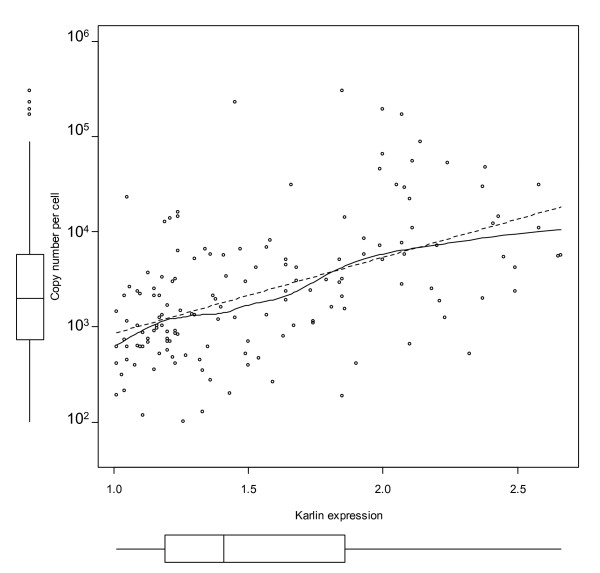
Results: Here, we describe an experimental scheme to maximize the coverage of proteins identified by mass spectrometry of a complex biological sample. Using a combination of LC-MS/MS approaches with protein and peptide fractionation steps we identified 1103 proteins from the cytosolic fraction of the Escherichia coli strain MC4100. A measure of abundance is presented for each of the identified proteins, based on the recently developed emPAI approach which takes into account the number of sequenced peptides per protein. The values of abundance are within a broad range and accurately reflect independently measured copy numbers per cell. As expected, the most abundant proteins were those involved in protein synthesis, most notably ribosomal proteins. Proteins involved in energy metabolism as well as those with binding function were also found in high copy number while proteins annotated with the terms metabolism, transcription, transport, and cellular organization were rare. The barrel-sandwich fold was found to be the structural fold with the highest abundance. Highly abundant proteins are predicted to be less prone to aggregation based on their length, pI values, and occurrence patterns of hydrophobic stretches. We also find that abundant proteins tend to be predominantly essential. Additionally we observe a significant correlation between protein and mRNA abundance in E. coli cells.

Conclusion: Abundance measurements for more than 1000 E. coli proteins presented in this work represent the most complete study of protein abundance in a bacterial cell so far. We show significant associations between the abundance of a protein and its properties and functions in the cell. In this way, we provide both data and novel insights into the role of protein concentration in this model organism.


Figures

Figure 1
Figure 1
Comparison of protein abundances in the E. coli cytosol of cells cultured in minimal and rich medium. Protein abundance as derived by emPAI values. 454 proteins with more than two identified peptides were evaluated in samples from minimal and rich medium. The dashed lines indicate the positions equivalent to a concentration ratio of 0.1 and 10. The emPAI values in the minimal and rich medium correlate significantly with a Pearson correlation coefficient of 0.7 (pval < 10-54) and 0.77 (p-value < 10-80) for logrithmized variables.
Figure 2
Figure 2
Correlation between observed emPAI values and independently measured protein copy numbers per cell. Protein abundances in the E. coli cytosol as measured by the emPAI approach correlate well with protein copy numbers per cell measured independently by isotope dilution using spiked E. coli BW25113 cells containing 40 proteins with known amounts [33]. A dynamic range of approximately 4 orders of magnitude of protein copy numbers per cell is covered. The Pearson correlation coefficient is 0.84 with a p-value < 10-10 for logarithmized and 0.52 (p-value < 10-4) for non-logarithmized variables.
Figure 3
Figure 3
Observed concentration and protein detection frequencies. Correlation between the observed protein copy numbers (based on emPAI) and the detection frequency of the identified proteins. Detection frequency is defined as the average ratio of detection of the observed parent ions of a given protein in all performed LCMS experiments. Red dots indicate reference proteins (introduced in Figure 2), black dots indicate ribosomal proteins.
Figure 4
Figure 4
Abundance distribution of all identified proteins. Distributions are shown for the group of highly abundant proteins and the remaining low abundance protein group. Circles show distribution outliers as defined in Methods. The lower hinge represents the first quartile (25%) and the upper hinge the third quartile (75%). The high and low group were separated by clustering at a copy number cutoff of 2050 proteins per cell as described in Methods.
Figure 5
Figure 5
Abundance functional profile. Shown is the fraction of proteins which are involved in different functional categories in different abundance ranges. The first data point shows the functional breakdown of the 50 most abundant proteins, the second data point corresponds to the 100 most abundant proteins, and so on. Note that the fractions relative to the number of proteins (e.g. 50, 100...) do not sum up to 1 since a protein can have assigned multiple functions like protein synthesis and with binding function. The functional categories shown in the legend are the FunCat top level classifications as outlined in the Methods sections. In this plot all 1103 proteins – inclusive the 53 ribosomal proteins – are shown. Since the plot is based on relative ranking it is robust with respect to the observed copy number variability of these most abundant proteins.
Figure 6
Figure 6
Abundance and essentiality. The abundance distribution of essential and non-essential proteins is shown: essential proteins are more abundant than non-essential proteins. The medians which represent 50% of all proteins within each group are shown as thick black bars, the one in the essential group is clearly higher (613 copies per cell vs. 432). Additionally in the essential group proteins can be found in higher abundance ranges than non-essential proteins (as can be seen by the difference of the upper whisker and upper hinge). A Mann-Whitney test as well as a Kolmogorov-Smirnov test indicated that the abundance distributions of essential and non-essential proteins are significantly different with p-values 0.0002 and 0.0001 respectively.
Figure 7
Figure 7
Abundance versus codon adaptation index (CAI). Each point on the plot corresponds to a protein characterized by two values: abundance and CAI. The Spearman rank correlation coefficient rs between log-copy number and CAI is 0.5 and the Pearson correlation coefficient is 0.57 indicating a good non-random (p-values both < 10-16) correlation with some variance. The dotted line is a linear regression between log(copy number) and CAI, the solid line a loess local fitting curve.
Figure 8
Figure 8
Karlin's predicted gene expression and measured protein abundance. The dotted line is linear regression and the solid line a loess local fitting curve. The Pearson correlation coefficient between log(copy number) and Karlin's expression value is 0.52 (p-value < 10-12) and the Spearman's rho is 0.53 (p-value < 10-12).
Figure 9
Figure 9
Variance of abundance within known operons. Only the 33 operons for which we have abundance data of 3 or more proteins are considered. The variance of all 1050 proteins is 0.35 and shown as dashed line. Low variance within an operon shows that the abundance of its proteins is similar. Here in 91% (30 of 33) of all operons the variance is lower than the variance of all proteins (left to the vertical bar). Copy number values are distributed according to the extreme value distribution and were therefore logarithmized for better representation.

Similar articles

Cited by

References

    1. Ghaemmaghami S, Huh WK, Bower K, Howson RW, Belle A, Dephoure N, O'Shea EK, Weissman JS. Global analysis of protein expression in yeast. Nature. 2003;425:737–741. doi: 10.1038/nature02046. - DOI - PubMed
    1. Newman JR, Ghaemmaghami S, Ihmels J, Breslow DK, Noble M, DeRisi JL, Weissman JS. Single-cell proteomic analysis of S. cerevisiae reveals the architecture of biological noise. Nature. 2006;441:840–846. doi: 10.1038/nature04785. - DOI - PubMed
    1. Link AJ, Eng J, Schieltz DM, Carmack E, Mize GJ, Morris DR, Garvik BM, Yates JR., 3rd Direct analysis of protein complexes using mass spectrometry. Nature Biotechnology. 1999;17:676–682. doi: 10.1038/10890. - DOI - PubMed
    1. Peng J, Elias JE, Thoreen CC, Licklider LJ, Gygi SP. Evaluation of multidimensional chromatography coupled with tandem mass spectrometry (LC/LC-MS/MS) for large-scale protein analysis: the yeast proteome. Journal of Proteome Research. 2003;2:43–50. doi: 10.1021/pr025556v. - DOI - PubMed
    1. Gygi SP, Rist B, Gerber SA, Turecek F, Gelb MH, Aebersold R. Quantitative analysis of complex protein mixtures using isotope-coded affinity tags. Nat Biotechnol. 1999;17:994–999. doi: 10.1038/13690. - DOI - PubMed

Publication types

MeSH terms

Substances