Comparative Study
. 2008 Feb 28;57(4):511-23.
doi: 10.1016/j.neuron.2007.12.025.

Selective disruption of one Cartesian axis of cortical maps and receptive fields by deficiency in ephrin-As and structured activity

Affiliations
Comparative Study

Selective disruption of one Cartesian axis of cortical maps and receptive fields by deficiency in ephrin-As and structured activity

Jianhua Cang et al. Neuron. .

Abstract

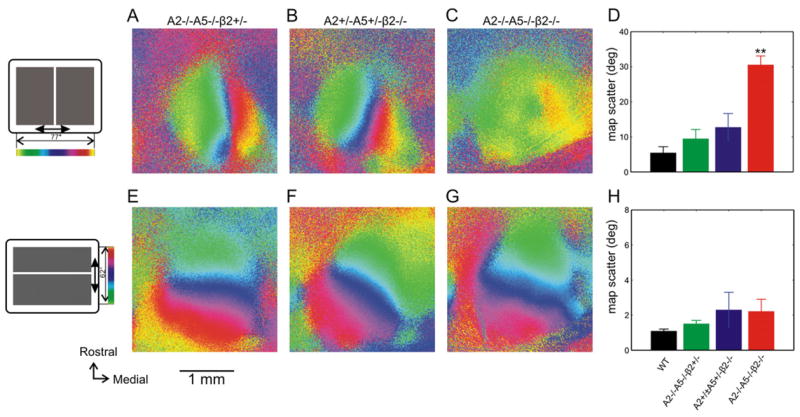
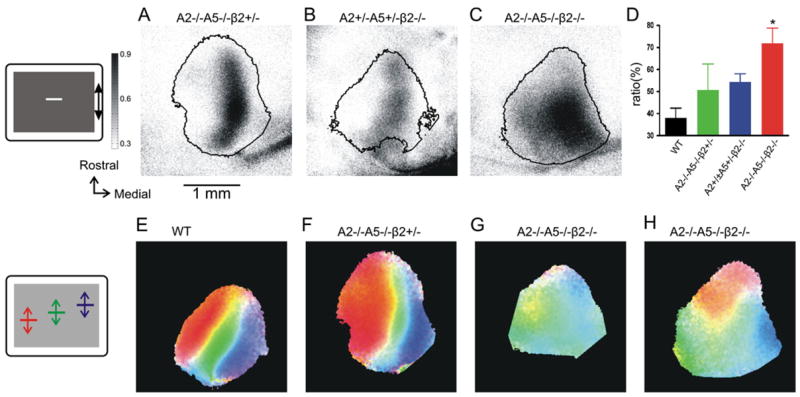
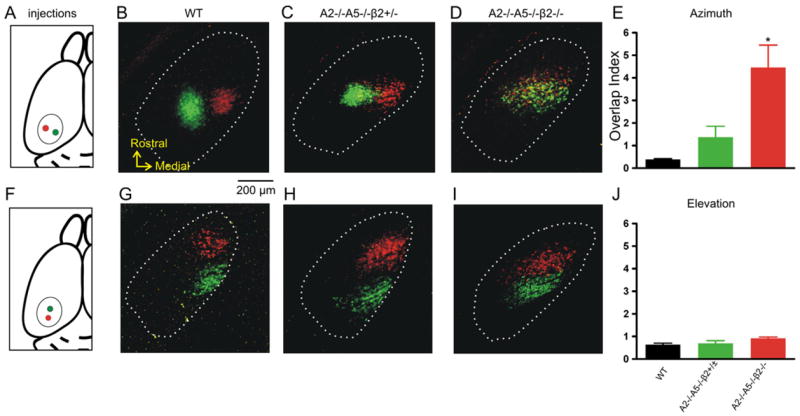
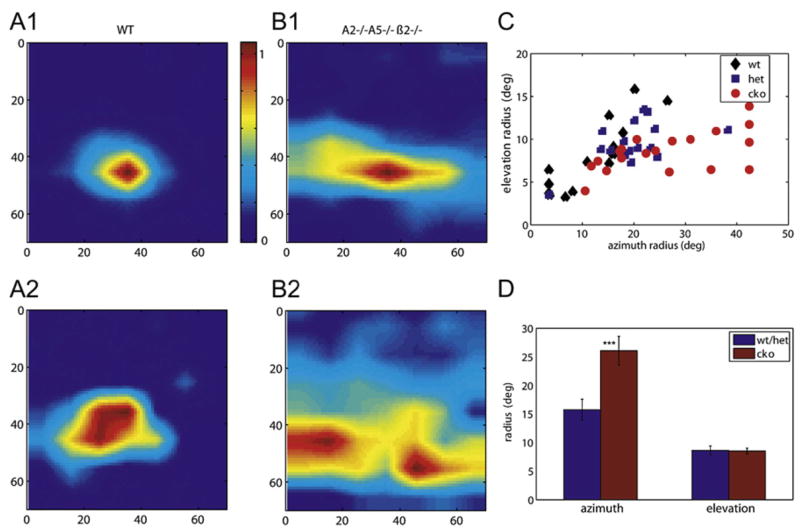
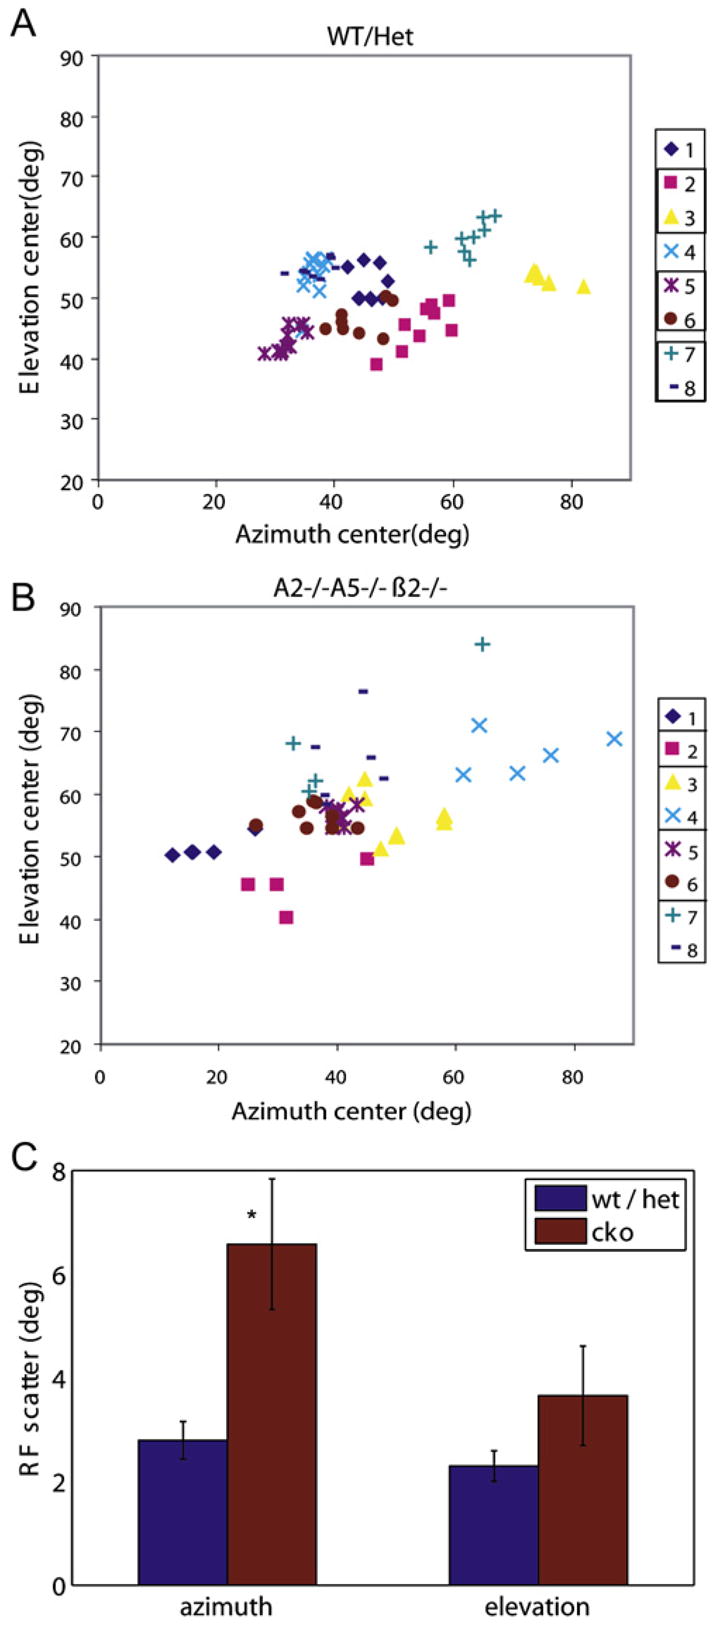
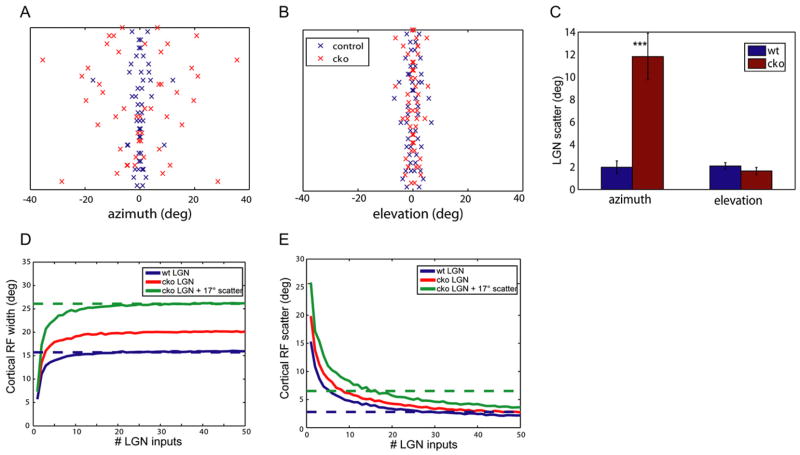
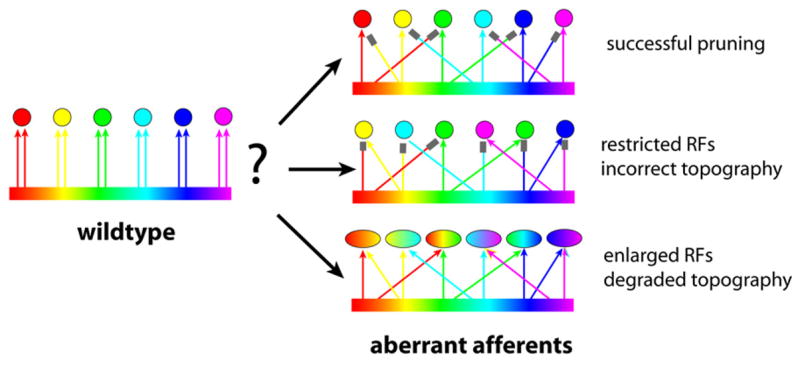
The topographic representation of visual space is preserved from retina to thalamus to cortex. We have previously shown that precise mapping of thalamocortical projections requires both molecular cues and structured retinal activity. To probe the interaction between these two mechanisms, we studied mice deficient in both ephrin-As and retinal waves. Functional and anatomical cortical maps in these mice were nearly abolished along the nasotemporal (azimuth) axis of the visual space. Both the structure of single-cell receptive fields and large-scale topography were severely distorted. These results demonstrate that ephrin-As and structured neuronal activity are two distinct pathways that mediate map formation in the visual cortex and together account almost completely for the formation of the azimuth map. Despite the dramatic disruption of azimuthal topography, the dorsoventral (elevation) map was relatively normal, indicating that the two axes of the cortical map are organized by separate mechanisms.


Figures

Figure 1
Figure 1. Cortical Azimuth Maps Are Severely Disrupted in Ephrin-A2A5-β2 Combination KOs
(A–C) Cortical azimuth maps of an A2−/−A5−/−β2+/− (A), an A2+/−A5+/−β2−/− (B), and an A2−/−A5−/−β2−/− combination KO (C). The color code used to represent positions of different azimuthal lines on the stimulus monitor is shown to the left of panel (A). Note that the lack of retinotopic organization in the map of A2−/−A5−/−β2−/− combination KO. (D) Quantification of map scatters for the azimuth maps of these genotypes. (E–H) Elevation maps of the same three mice and quantification of their map scatter. The color code is shown to the left. Error bars represent SEM.
Figure 2
Figure 2. Cortical Maps Revealed by Spatially Restricted Stimuli
(A–C) Maps of response magnitude of an A2 −/−A5 −/−β2+/− (A), an A2+/−A5+/−β2 −/− (B), and an A2 −/−A5−/−β2 −/− combination KO (C) to a spatially restricted stimulus as diagrammed in the leftmost panel. The response magnitude is displayed as fractional change in reflection ×104 in grayscale, shown to the left of panel (A). The black contour on each panel circles the region activated by full-screen stimulus (thresholded at a level of 30% of the peak response). (D) Activated areas in response to the spatially restricted stimulus as a percentage of full-screen elevation maps for different genotypes. (E–H) Topographic maps determined by spatially restricted stimuli. A diagram illustrating spatially restricted stimuli used to assay azimuth maps is shown in the leftmost panel. The color of each pixel on the map is determined by the relative response magnitude evoked by the bars along the three positions, with color component according to the diagram. (E) WT, (F) heterozygous control, (G and H) two examples of combination knockouts showing the range of results. Error bars represent SEM.
Figure 3
Figure 3. Disruption of Geniculocortical Map in Ephrin-A2A5-β2 Combination KOs
(A–D) Retrogradely labeled dLGN neurons of a WT (B), an A2−/−A5−/−β2+/− (C), and an A2 −/−A5 −/−β2 −/− (D). Neurons were labeled by injections of CTB-Alexa 488 (green) and CTB-Alexa 568 (red) at 500 μm apart in V1 along lateromedial axis (A). In all the panels, dotted lines mark the border of dLGN. Note the overlap between the green and red cells in (D). (E) Quantification of overlap between the two groups of labeled cells in the dLGN along the azimuth axis. (F–J) Retrograde labeling and quantification for dLGN neurons when the tracers were injected along elevation axis. Error bars represent SEM.
Figure 4
Figure 4. Single-Unit Recording in Visual Cortex Demonstrates that the Receptive Fields of Cortical Neurons in Combination KOs Are Selectively Enlarged in the Azimuthal Direction
(A and B) Representative receptive fields measured with moving short bars of two WT neurons (A1, 2) and two ephrin-A2A5-β2 combination KO neurons (B1, 2). Axes in degrees of visual space, color represents magnitude of response. (C) Receptive field radii in degrees, by Gaussian fit to sweeping short bar data, for all single units recorded. (D) Average receptive field size in azimuth and elevation from (C). (n = 31 units in control, 23 units combination KOs, from 5 animals each.) Error bars represent SEM.
Figure 5
Figure 5. Topography Is Degraded, but Still Present, in Combination KOs
(A and B) Receptive field centers for multi-unit recordings for WT and heterozygous littermate controls (A) and combination KOs (B). Units from the same penetration site are shown with the same color and symbol. n = 8 penetrations from five animals each, four to ten simultaneously recorded multi-units per penetration. (C) Scatter in receptive field center for all multi-units, relative to the mean of each penetration. n = 78 multi-units in controls, and n = 54 multi-units in combination knockouts (cko), from eight penetration in five animals each. Error bars represent SEM.
Figure 6
Figure 6. Single-Unit Receptive Fields in the dLGN
(A) Receptive fields of two single units recorded simultaneously in WT dLGN. (B) Similar receptive fields in a combination KO are displaced in azimuth relative to each other. (C) Scatter plot of single-unit receptive field radius shows normal receptive field size in combination KOs, except for a few units expanded in azimuth. (D) Average receptive fields sizes (n = 35 units WT, 38 units combination KOs, 3 animals each). Error bars represent SEM.
Figure 7
Figure 7. Disrupted Topography in dLGN, and Its Effect on Cortical Receptive Fields
(A) Position in azimuth of RF centers for single and multi-units recorded simultaneously in dLGN, aligned to the mean for that site. (B) Position in elevation of receptive field centers. (C) Average scatter in receptive field center for simultaneously recorded units (n = 20 sites, 3 animals each). (D and E) Model of effects of dLGN receptive field parameters on cortical RF size (D) and RF scatter (E). Blue and green dashed lines demarcate observed cortical RF size in control and combination KO, respectively, while solid lines represent results of simulation with various geniculate RF parameters. Error bars represent SEM.
Figure 8
Figure 8
Hypotheses for Possible Consequences of Disrupting Afferent Organization in a Topographic Projection, Illustrating Differential Effects on Large-Scale Organization versus Local Receptive Field Structure

References

    1. Alonso JM, Usrey WM, Reid RC. Rules of connectivity between geniculate cells and simple cells in cat primary visual cortex. J Neurosci. 2001;21:4002–4015. - PMC - PubMed
    1. Brainard DH. The psychophysics toolbox. Spat Vis. 1997;10:433–436. - PubMed
    1. Bruno RM, Sakmann B. Cortex is driven by weak but synchronously active thalamocortical synapses. Science. 2006;312:1622–1627. - PubMed
    1. Cang J, Kaneko M, Yamada J, Woods G, Stryker MP, Feldheim DA. Ephrin-as guide the formation of functional maps in the visual cortex. Neuron. 2005a;48:577–589. - PMC - PubMed
    1. Cang J, Renteria RC, Kaneko M, Liu X, Copenhagen DR, Stryker MP. Development of precise maps in visual cortex requires patterned spontaneous activity in the retina. Neuron. 2005b;48:797–809. - PMC - PubMed

Publication types