

Robust score statistics for QTL linkage analysis
- PMID: 18304491
- PMCID: PMC2427220
- DOI: 10.1016/j.ajhg.2007.11.012
Robust score statistics for QTL linkage analysis
Abstract
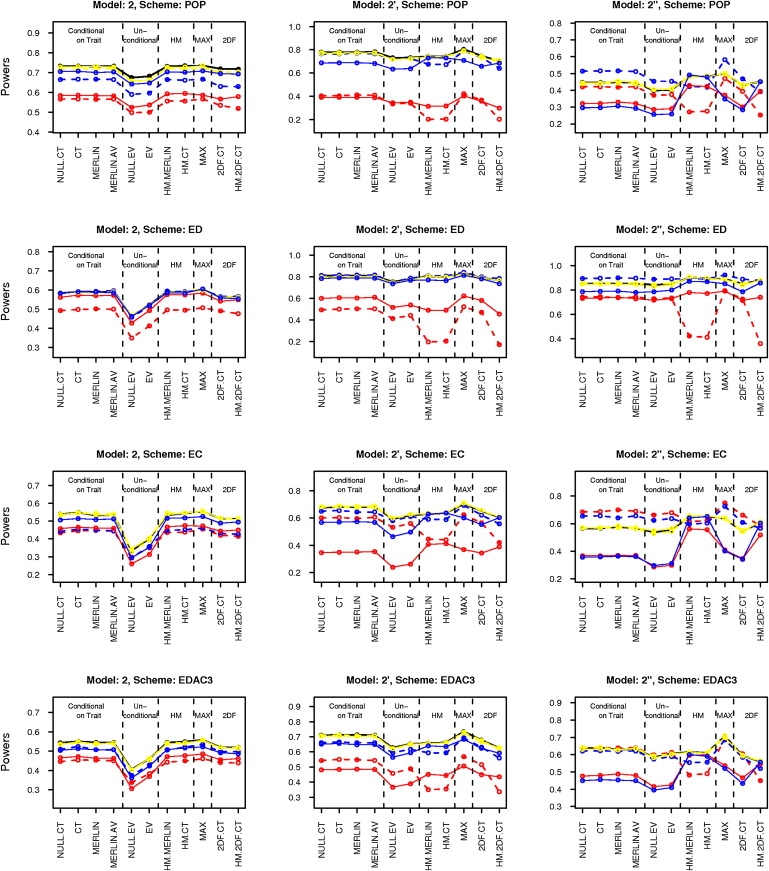
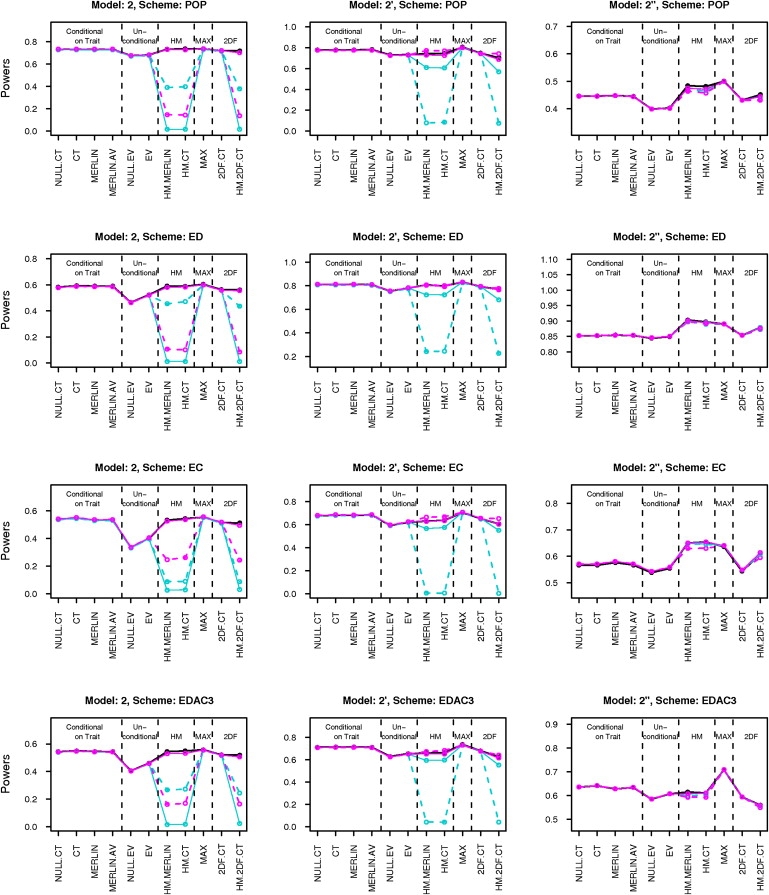
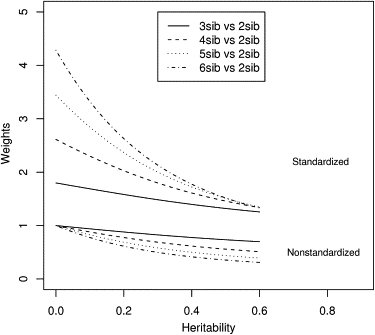
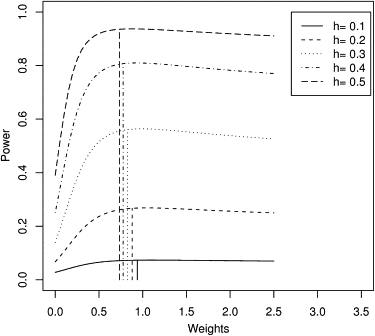
The traditional variance components approach for quantitative trait locus (QTL) linkage analysis is sensitive to violations of normality and fails for selected sampling schemes. Recently, a number of new methods have been developed for QTL mapping in humans. Most of the new methods are based on score statistics or regression-based statistics and are expected to be relatively robust to non-normality of the trait distribution and also to selected sampling, at least in terms of type I error. Whereas the theoretical development of these statistics is more or less complete, some practical issues concerning their implementation still need to be addressed. Here we study some of these issues such as the choice of denominator variance estimates, weighting of pedigrees, effect of parameter misspecification, effect of non-normality of the trait distribution, and effect of incorporating dominance. We present a comprehensive discussion of the theoretical properties of various denominator variance estimates and of the weighting issue and then perform simulation studies for nuclear families to compare the methods in terms of power and robustness. Based on our analytical and simulation results, we provide general guidelines regarding the choice of appropriate QTL mapping statistics in practical situations.
Figures
Similar articles
-
Quantitative trait locus analysis of hybrid pedigrees: variance-components model, inbreeding parameter, and power.BMC Genet. 2007 Jul 26;8:50. doi: 10.1186/1471-2156-8-50. BMC Genet. 2007. PMID: 17651509 Free PMC article.
-
Simultaneous fine mapping of closely linked epistatic quantitative trait loci using combined linkage disequilibrium and linkage with a general pedigree.Genet Sel Evol. 2008 May-Jun;40(3):265-78. doi: 10.1186/1297-9686-40-3-265. Epub 2008 Apr 10. Genet Sel Evol. 2008. PMID: 18400149 Free PMC article.
-
A powerful and robust method for mapping quantitative trait loci in general pedigrees.Am J Hum Genet. 2005 Jul;77(1):97-111. doi: 10.1086/431683. Epub 2005 May 25. Am J Hum Genet. 2005. PMID: 15918154 Free PMC article.
-
QTL analysis in arbitrary pedigrees with incomplete marker information.Heredity (Edinb). 2002 Nov;89(5):339-45. doi: 10.1038/sj.hdy.6800136. Heredity (Edinb). 2002. PMID: 12399991 Review.
-
How to model a complex trait. 1. General considerations and suggestions.Hum Hered. 2003;55(4):202-10. doi: 10.1159/000073204. Hum Hered. 2003. PMID: 14566098 Review.
Cited by
-
Applying novel genome-wide linkage strategies to search for loci influencing type 2 diabetes and adult height in American Samoa.Hum Biol. 2008 Apr;80(2):99-123. doi: 10.3378/1534-6617(2008)80[99:ANGLST]2.0.CO;2. Hum Biol. 2008. PMID: 18720898 Free PMC article.
-
A generalized family-based association test for dichotomous traits.Am J Hum Genet. 2009 Sep;85(3):364-76. doi: 10.1016/j.ajhg.2009.08.003. Am J Hum Genet. 2009. PMID: 19732865 Free PMC article.
-
Mapping quantitative traits in unselected families: algorithms and examples.Genet Epidemiol. 2009 Nov;33(7):617-27. doi: 10.1002/gepi.20413. Genet Epidemiol. 2009. PMID: 19278016 Free PMC article.
-
Variance components linkage analysis with repeated measurements.Hum Hered. 2009;67(4):237-47. doi: 10.1159/000194977. Epub 2008 Jan 27. Hum Hered. 2009. PMID: 19172083 Free PMC article.
-
Genome-wide linkage scan to identify loci associated with type 2 diabetes and blood lipid phenotypes in the Sikh Diabetes Study.PLoS One. 2011;6(6):e21188. doi: 10.1371/journal.pone.0021188. Epub 2011 Jun 16. PLoS One. 2011. PMID: 21698157 Free PMC article.
References
Publication types
MeSH terms
Grants and funding
LinkOut - more resources
Full Text Sources
