. 2008 Mar;82(3):685-95.
doi: 10.1016/j.ajhg.2007.12.010. Epub 2008 Jan 24.

The fine-scale and complex architecture of human copy-number variation

Affiliations

The fine-scale and complex architecture of human copy-number variation

George H Perry et al. Am J Hum Genet. 2008 Mar.

Abstract

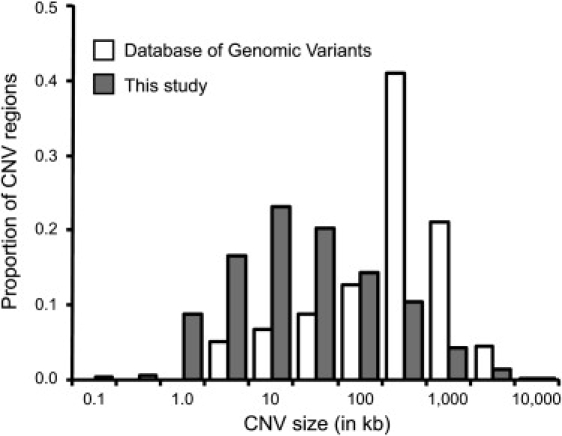
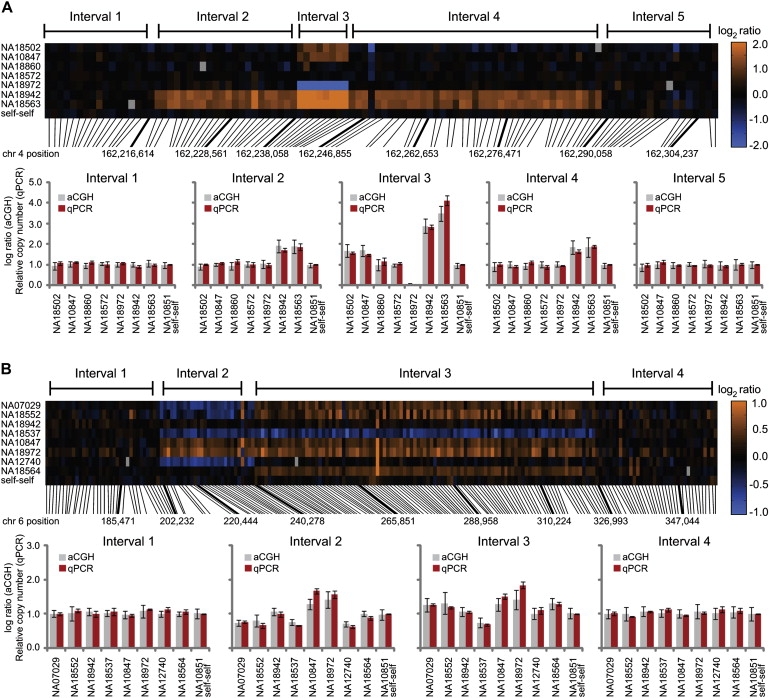
Despite considerable excitement over the potential functional significance of copy-number variants (CNVs), we still lack knowledge of the fine-scale architecture of the large majority of CNV regions in the human genome. In this study, we used a high-resolution array-based comparative genomic hybridization (aCGH) platform that targeted known CNV regions of the human genome at approximately 1 kb resolution to interrogate the genomic DNAs of 30 individuals from four HapMap populations. Our results revealed that 1020 of 1153 CNV loci (88%) were actually smaller in size than what is recorded in the Database of Genomic Variants based on previously published studies. A reduction in size of more than 50% was observed for 876 CNV regions (76%). We conclude that the total genomic content of currently known common human CNVs is likely smaller than previously thought. In addition, approximately 8% of the CNV regions observed in multiple individuals exhibited genomic architectural complexity in the form of smaller CNVs within larger ones and CNVs with interindividual variation in breakpoints. Future association studies that aim to capture the potential influences of CNVs on disease phenotypes will need to consider how to best ascertain this previously uncharacterized complexity.


Figures

Figure 1
Figure 1
Size Distribution of CNVs from the Database of Genomic Variants, with Corresponding CNVs from This Study We identified CNVs in at least one individual for 1153 of 2191 putative CNV regions annotated in the Database of Genomic Variants (DGV) as of 30 November 2006. Size distributions for these regions are shown in log scale, with 10-fold multiples of 1 and √10, based on the size of each region from DGV and the estimates from our study of the total amount of copy-number-variable sequence within and overlapping the DGV-defined region. Our estimates were smaller than the corresponding DGV region for 1020 of the 1153 loci (88%) and smaller by more than 50% for 876 regions (76%).
Figure 2
Figure 2
CNV Breakpoint Sequencing We developed a PCR amplification and sequencing strategy (see Figure S3) for nucleotide-level resolution of CNV breakpoints. (A) Log2 ratios for 30 HapMap samples for a CNV region on human chromosome 10 (hg17). Probes are depicted as solid circles. The log2 ratios form three distinct clusters (gain, no change, and loss relative to the reference individual NA10851). PCR primer locations are depicted as arrows. (B) Results of PCR amplification, with a 1.2% agarose gel with ethidium bromide staining. Amplification was successful for individuals with no change and losses relative to the reference individual, as well as for the reference individual. Amplification was unsuccessful for individuals with a relative gain, suggesting that the reference individual is heterozygous for a deletion in this genomic region. (C) Chromatogram from NA18975 and comparison to the human reference genome sequence (hg17) to precisely identify the CNV breakpoint. All sequenced individuals were observed to have identical breakpoints.
Figure 3
Figure 3
Enrichment for Tandem Repeats within Individual CNV Breakpoint-Region Sequences This figure depicts the empirical cumulative distribution of the observed longest repeated subsequence ki (k × i), where k = the length of the repeated subsequence and i = the number of recurrences within the sequence, for the sequences between the copy-number-variable probes at CNV boundaries and the adjacent non-copy-number-variable probes estimated to harbor breakpoints in our study (CNV breakpoint sequences; approximately 1 kb each), sequences from between random pairs of adjacent non-CNV probes on the array (random interprobe sequences), and a random set of genome-wide sequences. The random sequences were selected such as to not alter the characteristics of the observed set of CNV calls, in terms of lengths and proximity of the end sequences. The graph reflects only the significant end of the distribution—the top 100 sequences as ranked by ki. A larger proportion of CNV breakpoint-region sequences contain long tandem repeats than the random sequences.
Figure 4
Figure 4
Simple CNVs and Inference of Genotypes, Based on Discrete Log2-Ratio Clustering For two CNV-containing genomic regions that have similar estimated breakpoints across all individuals, probe-by-probe log2 ratios are depicted in heatmaps (see scale bar) in the upper panel (with rows representing individuals and columns representing probes ordered by genomic position). Mean log2 ratios of the probes within the CNV are provided in the lower panel. The mean log2 ratios form discrete clusters, letting us infer CNV genotypes. For both loci, there is one cluster with strongly negative log2 ratios, suggesting that these individuals have homozygous deletions for this DNA segment. For the CNV on chromosome 4 at 155.5 Mb (hg17), there are three mean log2-ratio clusters, likely reflecting zero, one, and two copies of this DNA segment. For the CNV on chromosome 12 at 130.8 Mb there are four mean log2-ratio clusters, likely reflecting states of zero, one, two, and three copies; therefore, this CNV would be considered to be multiallelic. Error bars represent the standard deviation (SD).
Figure 5
Figure 5
Validation of Architecturally Complex CNV Regions by qPCR We used a series of quantitative PCR (qPCR) probes positioned across CNV regions to validate the patterns of architectural complexity observed with our CNV-enriched array. The probe-by-probe log2 ratios depicted in the heatmaps (see scale bars) illustrate examples of a smaller CNV inside a larger one on chromosome 4 at 162.2 Mb (A) and a CNV with immediately adjacent and variably present CNVs (i.e., juxtaposed gain and loss CNV calls in the same individual) on chromosome 6 at 0.2 Mb (B). The relative genomic positions of the probes are depicted with black lines, with midpoint positions (hg17) provided for selected probes (thicker lines). For each CNV, qPCR primers were designed at intervals throughout and flanking the CNV region and tested on all individuals depicted in the heatmaps. The qPCR results (i.e., relative copy number to the reference individual NA10851) are consistent with the aCGH results provided as log ratio (i.e., to be on a consistent scale with the qPCR results) for each interval. Error bars represent the SD. See Table S11 for qPCR primers and results.

Similar articles

Cited by

References

    1. Ottolenghi S., Lanyon W.G., Paul J., Williamson R., Weatherall D.J., Clegg J.B., Pritchard J., Pootrakul S., Boon W.H. The severe form of alpha thalassaemia is caused by a haemoglobin gene deletion. Nature. 1974;251:389–392. - PubMed
    1. Taylor J.M., Dozy A., Kan Y.W., Varmus H.E., Lie-Injo L.E., Ganesan J., Todd D. Genetic lesion in homozygous alpha thalassaemia (hydrops fetalis) Nature. 1974;251:392–393. - PubMed
    1. Ottolenghi S., Comi P., Giglioni B., Tolstoshev P., Lanyon W.G., Mitchell G.J., Williamson R., Russo G., Musumeci S., Schillro G. Delta-beta-thalassemia is due to a gene deletion. Cell. 1976;9:71–80. - PubMed
    1. Nathans J., Thomas D., Hogness D.S. Molecular genetics of human color vision: The genes encoding blue, green, and red pigments. Science. 1986;232:193–202. - PubMed
    1. Awdeh Z.L., Alper C.A. Inherited structural polymorphism of the fourth component of human complement. Proc. Natl. Acad. Sci. USA. 1980;77:3576–3580. - PMC - PubMed

Publication types

Associated data