. 2008 May;19(5):943-52.
doi: 10.1681/ASN.2007080864. Epub 2008 Feb 27.

Maternal diabetes modulates renal morphogenesis in offspring

Affiliations

Maternal diabetes modulates renal morphogenesis in offspring

Stella Tran et al. J Am Soc Nephrol. 2008 May.

Abstract

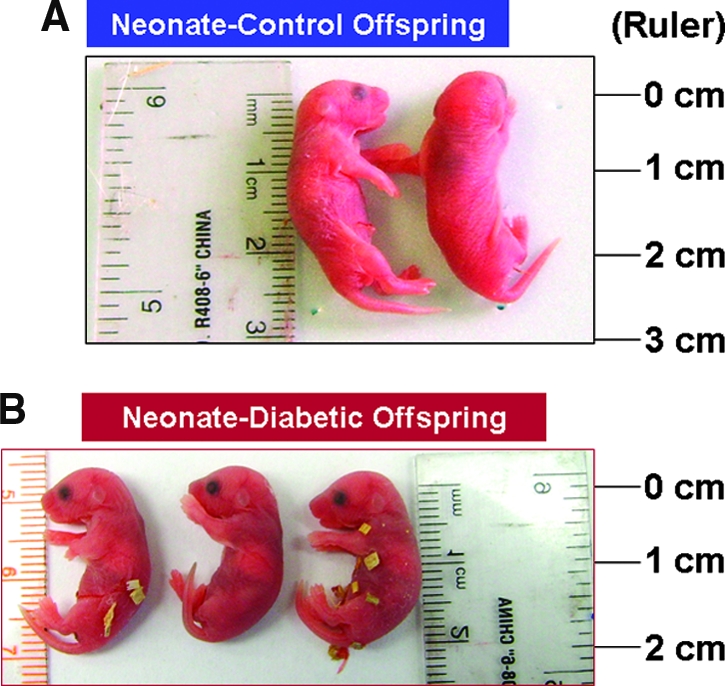
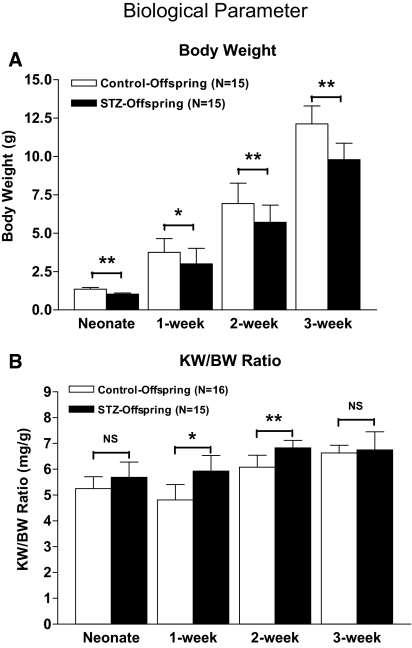
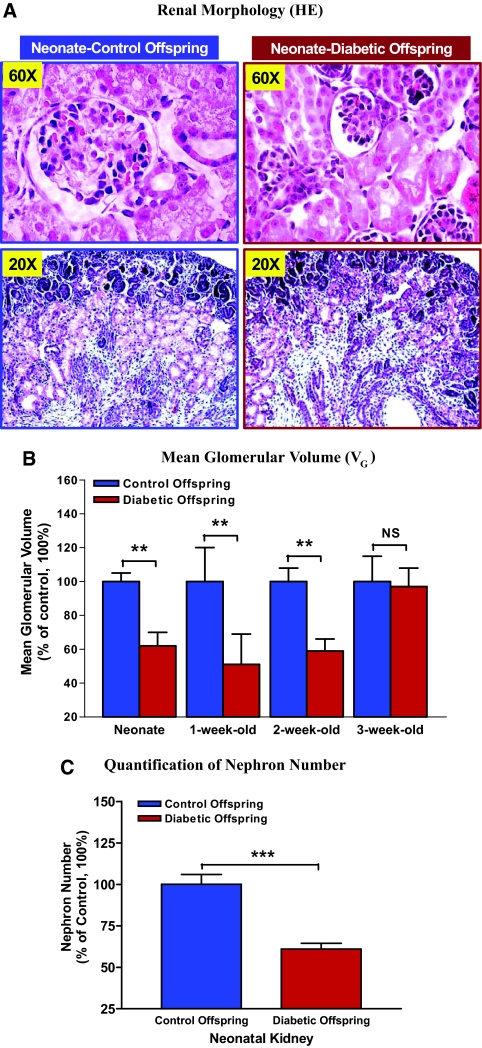
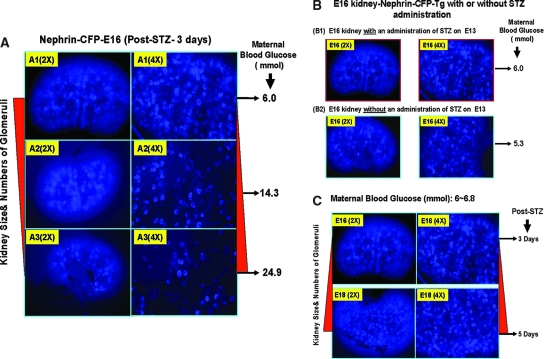
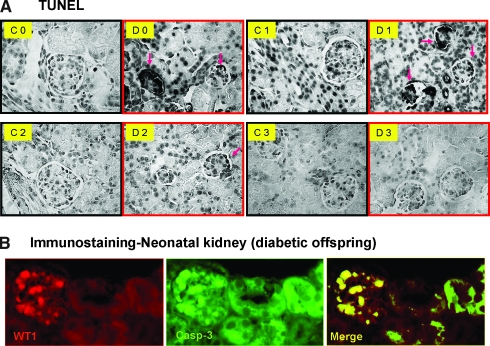
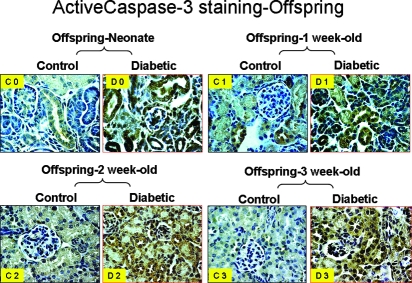
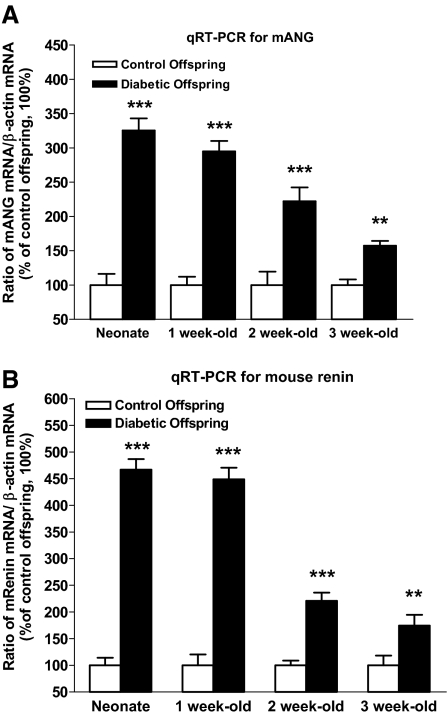
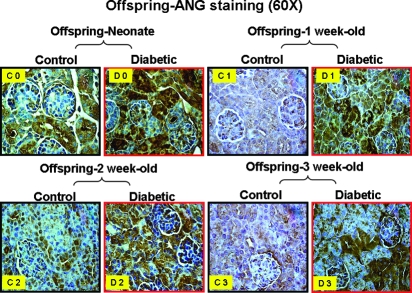
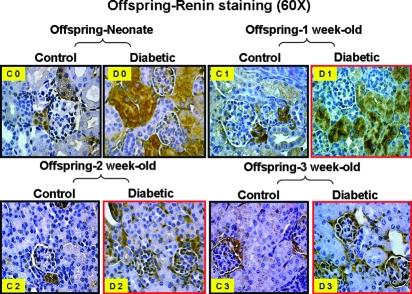
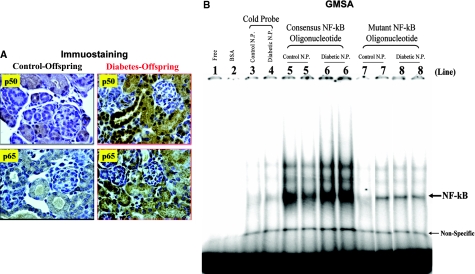
Maternal diabetes leads to an adverse in utero environment, but whether maternal diabetes impairs nephrogenesis is unknown. Diabetes was induced with streptozotocin in pregnant Hoxb7-green fluorescence protein mice at embryonic day 13, and the offspring were examined at several time points after birth. Compared with offspring of nondiabetic controls, offspring of diabetic mice had lower body weight, body size, kidney weight, and nephron number. The observed renal dysmorphogenesis may be the result of increased apoptosis, because immunohistochemical analysis revealed significantly more apoptotic podocytes as well as increased active caspase-3 immunostaining in the renal tubules compared with control mice. Regarding potential mediators of these differences, offspring of diabetic mice had increased expression of intrarenal angiotensinogen and renin mRNA, upregulation of NF-kappaB isoforms p50 and p65, and activation of the NF-kappaB pathway. In conclusion, maternal diabetes impairs nephrogenesis, possibly via enhanced intrarenal activation of the renin-angiotensin system and NF-kappaB signaling.


Figures

Figure 1.
Figure 1.
Image of representative newborn Hoxb7-GFP mice from nondiabetic and diabetic mothers. The offspring of diabetic mothers are significantly smaller than those of nondiabetic mothers (control).
Figure 2.
Figure 2.
Physical parameters in offspring of Hoxb7-GFP-Tg mice. (A) Offspring from diabetic mother had significantly lower body weight (BW; 20% less on average) than control offspring during the entire suckling period (neonate to 3 wk of age). (B) The ratios of kidney weight (KW) to BW in offspring from diabetic mother were also significantly higher than those of control offspring. □, control offspring; ▪, offspring from diabetic mother. *P < 0.05; **P < 0.01.
Figure 3.
Figure 3.
Renal morphology and VG measurement. (A) hematoxylin and eosin (HE) staining indicates that kidney and glomerular size of neonatal offspring from diabetic mother (right) are smaller as compared with control offspring (left). (B) Quantification of VG value in control and diabetic offspring from neonate to 3 wk of age. The y axis shows the percentage of VG value compared with control animal (100%). Blue bar, control offspring (neonate: n = 9; 1 wk old: n = 12; 2 wk old: n = 9; 3 wk old: n = 8); red bar, diabetic offspring (neonate: n = 8; 1 wk old: n = 8; 2 wk old: n = 7; 3 wk old: n = 8). **P ≤ 0.01. (C) Quantification of neonatal nephron number. The y axis shows the percentage of nephron number compared with control animal (100%). Blue bar, control offspring (neonate: n = 6); red bar, diabetic offspring (neonate: n = 5). ***P ≤ 0.001.
Figure 4.
Figure 4.
STZ toxicity studies in Nephrin-CFP-Tg mice. (A) E16 kidney isolated from pregnant mice with three different maternal hyperglycemic levels after 3 d of STZ administration (150 mg/kg, intraperitoneally, at E13): Normal (6.0 mmol), mild (14.3 mmol), and severe (24.9 mmol). (B) E16 kidneys isolated from pregnant mice in normal maternal glucose range with or without administration of STZ at E13. (C) E16 and E18 kidneys isolated from pregnant mice with normal maternal glucose level with STZ administration at E13.
Figure 5.
Figure 5.
Apoptotic assay (TUNEL; A) in kidneys of offspring from nondiabetic and diabetic mothers: Neonate (C0 and D0), offspring at 1 wk of age (C1 and D1), offspring at 2 wk of age (C2 and D2), and offspring at 3 wk of age (C3 and D3). (B) Double immunostaining of WT-1 (a) and active caspase-3 expression (b) as well as a merged image (c) in neonatal kidneys of offspring from nondiabetic and diabetic mothers. Magnification, ×60. Pink arrows indicate the apoptotic cells.
Figure 6.
Figure 6.
Active caspase-3 expression in kidneys of offspring from nondiabetic (control) and diabetic mothers: Neonate (C0 and D0), offspring at 1-wk old (C1 and D1), offspring at 2-wk old (C2 and D2), and offspring at 3 wk-old (C3 and D3). Magnification, ×60.
Figure 7.
Figure 7.
Mouse angiotensinogen (mANG) and renin mRNA expression assayed by RT-qPCR. (A and B) Expression levels of ANG (A) and renin (B) mRNA in kidneys of offspring from nondiabetic and diabetic mothers from neonate to 3 wk of age. **P ≤ 0.01; ***P ≤ 0.001.
Figure 8.
Figure 8.
ANG protein expression in kidneys of offspring from nondiabetic (control) and diabetic mothers: Neonate (C0 and D0), offspring at 1 wk of age (C1 and D1), offspring at 2 wk of age (C2 and D2), and offspring at 3 wk of age (C3 and D3). Magnification, ×60.
Figure 9.
Figure 9.
Renin protein expression in kidneys of offspring from nondiabetic (control) and diabetic mothers: Neonate (C0 and D0), offspring at 1 wk of age (C1 and D1), offspring at 2 wk of age (C2 and D2), and offspring at 3 wk of age (C3 and D3). Magnification, ×60.
Figure 10.
Figure 10.
NF-κB expression and localization as well as activation in neonate kidneys from control and diabetic mothers. (A) Expression and localization of two isoforms of NF-κB, p50 and p65, were displayed by immunostaining. (B) GMSA assay. The labeled DNA probe (0.1 pmol) was incubated without (lane 1) or with BSA (10 μg; lane 2) or renal nuclear protein(s) (N.P.; 10 μg each) of neonatal kidney (lanes 3 through 8) in the presence of 0.3 U of poly dI-dC. Renal N.P. from neonatal control (lanes 3, 5, and 7) and diabetic offspring (lanes 4, 6, and 8) is incubated with consensus NF-κB DNA cold probe (lanes 3 and 4), consensus NF-κB DNA probe (lanes 5 and 6), and mutant NF-κB DNA probe (lanes 7 and 8). Magnification ×60.

Comment in

References

    1. Holemans K, Aerts L, Van Assche FA: Fetal growth and long-term consequences in animal models of growth retardation. Eur J Obstet Gynecol Reprod Biol 81: 149–156, 1998 - PubMed
    1. Holemans K, Gerber RT, Meurrens K, De Clerck F, Poston L, Van Assche FA: Streptozotocin diabetes in the pregnant rat induces cardiovascular dysfunction in adult offspring. Diabetologia 42: 81–89, 1999 - PubMed
    1. Holemans K, Caluwaerts S, Van Assche FA: Unravelling the fetal origins hypothesis. Lancet 360: 2073–2075, 2002 - PubMed
    1. Holemans K, Aerts L, Van Assche FA: Fetal growth restriction and consequences for the offspring in animal models. J Soc Gynecol Investig 10: 392–399, 2003 - PubMed
    1. Holemans K, Aerts L, Van Assche FA: Lifetime consequences of abnormal fetal pancreatic development. J Physiol 547: 11–20, 2003 - PMC - PubMed

Publication types

MeSH terms