. 2008 Mar 11;105(10):4010-5.
doi: 10.1073/pnas.0708927105. Epub 2008 Feb 27.

Internal body state influences topographical plasticity of sensory representations in the rat gustatory cortex

Affiliations

Internal body state influences topographical plasticity of sensory representations in the rat gustatory cortex

Riccardo Accolla et al. Proc Natl Acad Sci U S A. .

Abstract

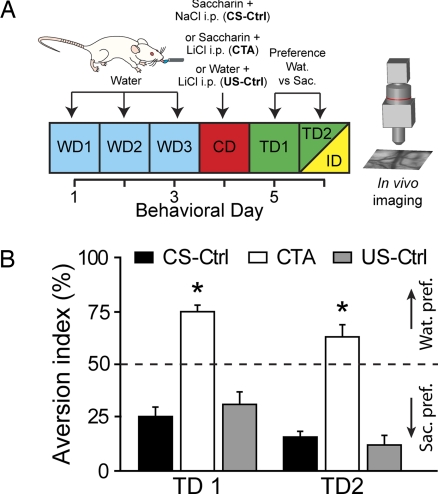
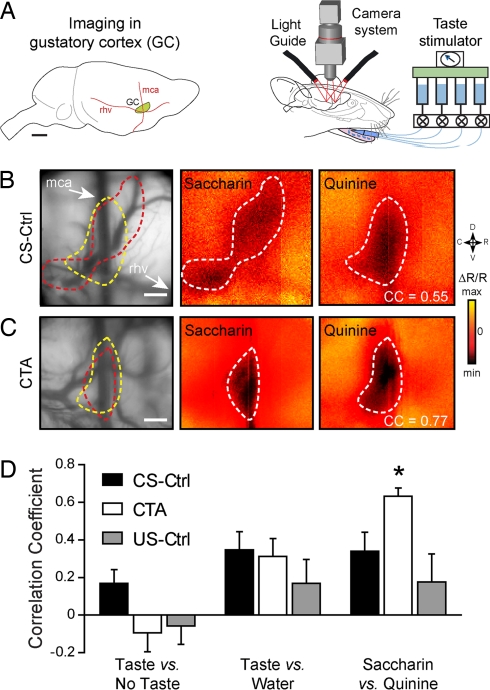
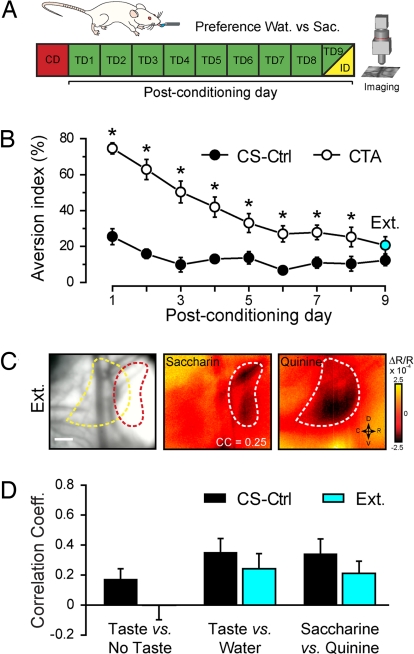
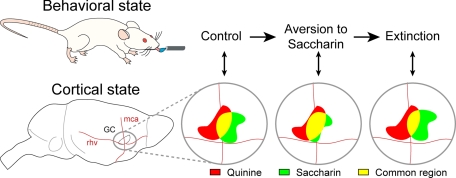
Primary sensory cortices are remarkably organized in spatial maps according to specific sensory features of the stimuli. These cortical maps can undergo plastic rearrangements after changes in afferent ("bottom-up") sensory inputs such as peripheral lesions or passive sensory experience. However, much less is known about the influence of "top-down" factors on cortical plasticity. Here, we studied the effect of a visceral malaise on taste representations in the gustatory cortex (GC). Using in vivo optical imaging, we showed that inducing conditioned taste aversion (CTA) to a sweet and pleasant stimulus induced plastic rearrangement of its cortical representation, becoming more similar to a bitter and unpleasant taste representation. Using a behavior task, we showed that changes in hedonic perception are directly related to the maps plasticity in the GC. Indeed imaging the animals after CTA extinction indicated that sweet and bitter representations were dissimilar. In conclusion, we showed that an internal state of malaise induces plastic reshaping in the GC associated to behavioral shift of the stimulus hedonic value. We propose that the GC not only encodes taste modality, intensity, and memory but extends its integrative properties to process also the stimulus hedonic value.


Conflict of interest statement

The authors declare no conflict of interest.

Figures

Fig. 1.
Fig. 1.
Acquisition of conditioned taste aversion (CTA) to saccharin. (A) Schema of the behavioral paradigm. Rats were water-deprived and trained for 3 days [water days (WD)] to drink distilled water over a 10-min access period. On the conditioning day (CD), either saccharin (CTA and CS-Ctrl) or distilled water (US-Ctrl) is given. Thirty minutes later, either LiCl (0.15 M, 2% body weight) was injected i.p. to induce visceral malaise (CTA and US-Ctrl groups) or NaCl (0.9%, 2% b.w.) was injected i.p. (CS-Ctrl group). In the following test days (TD1 and TD2), a preference test for distilled water (Wat.) over saccharin (Sac.) was performed. On TD2, after the preference evaluation, animals were anesthetized, and in vivo gustatory cortex imaging was conducted (ID, yellow). (B) Aversion index (water over total fluid intake) histograms proving CTA induction to saccharin. The dotted line represents no preference between the two solutions. Control animals showed a strong preference for saccharin, whereas the CTA animals associated saccharin with the malaise and exhibited a strong aversion to it (*, unpaired t test comparison with control groups at least P < 0.006).
Fig. 2.
Fig. 2.
CTA alters tastant representation in the gustatory cortex (GC). (A) (Left) Approximate size and location of the primary GC with respect to anatomical landmarks (blood vessels). mca, middle cerebral artery; rhv, rhinal veins. (Scale bar, 2 mm.) (Right) Schematic drawing of the stimulation and imaging systems. Fluids are delivered through pressurized reservoirs, using a computer-driven valve system, and the images are acquired through a CCD camera while illuminating the exposed cortex with light guides. (B and C) (Left) vascular pattern taken with a 546-nm illumination filter. The following images represent intrinsic signal responses averaged >16 presentations of 5 mM saccharin and 20 mM quinine in a CS-Ctrl (B) or a CTA animal (C). Correlation coefficients (CC) between quinine and saccharin images of the same animal are indicated. Tastant-activated cortical areas are outlined in white on the responses, and, for each example, the two different outlines are reported on the blood vessel pattern image. Minimum (×10−4) = −0.8 (Sac) (B), −1.5 (Qui) (B), and −4.5 (Sac and Qui) (C); maximum (×10−4) = 0.8 (Sac) (B), 1.5 (Qui) (B), and 4.5 (Sac and Qui) (C). (Scale bars, 500 μm.) (D) Maps correlation coefficient histograms for the CS-Ctrl (black, n = 8), the CTA (white, n = 8), and the US-Ctrl (gray, n = 5) groups. Three conditions are plotted: taste (Sac. and Qui.) versus no stimulus images, taste versus distilled water, and saccharin versus quinine. Only the Sac. versus Qui. correlation was statistically different between the CTA and CS-Ctrl or US-Ctrl groups (PCTA/CS-Ctrl < 0.03; PCTA/US-Ctrl < 0.005).
Fig. 3.
Fig. 3.
Cortical representation after CTA extinction. (A) Schema of the behavioral paradigm. After the conditioning day (CD), CS-Ctrl and CTA rats were subjected to a preference test for water over saccharin for 9 consecutive days (TD1 to TD9) until at least 80% of Sac reacceptance was reached (with respect to the average CS-Ctrl intake of Sac). On TD9, after the preference evaluation, an animal was anesthetized, and in vivo gustatory cortex imaging was conducted (ID). (B) Aversion index curves for CS-Ctrl (black circle) and CTA (white circle) rats. Note the progressive extinction of saccharin aversion in the CTA group (ANOVA F(8,48) = 3.57, P < 0.003). After 9 days, CTA rats displayed a similar preference toward saccharin compared with the control group (blue circle). *, posthoc LSD test, at least P < 0.05. (C) Example of intrinsic responses averaged >24 presentations of saccharin and quinine in an animal that experienced CTA extinction. Tastant-activated area is outlined in white on the responses, and the two different outlines are reported in the blood vessel pattern (left histogram). Correlation coefficient (CC) between quinine and saccharin images is indicated. (Scale bar, 500 μm.) (D) Correlation coefficient histograms for the control (black, n = 8) and the extinction (cyan, n = 8) groups. None of the comparisons between CS-Ctrl and EXT groups were statistically different.
Fig. 4.
Fig. 4.
Relationship between behavioral state and cortical state in the gustatory cortex. In a naïve (i.e., control) rat, cortical representations of the hedonically positive (saccharin) and negative (quinine) tastants are quite different, although common activated cortical territories exist (in yellow). After pairing a malaise to the ingestion of saccharin, the rat displays a strong aversion to saccharin. The change in hedonic value of saccharin is associated to a change of its cortical representation that becomes more similar (high correlation) to the quinine one. After saccharin aversion extinction, the hedonic value of saccharin is positive again, and its cortical map is again less similar (low correlation) to quinine. Note that the new representation of saccharin after extinction may not be a simple return to the one before conditioning.

Similar articles

Cited by

References

    1. Buonomano DV, Merzenich MM. Cortical plasticity: From synapses to maps. Annu Rev Neurosci. 1998;21:149–186. - PubMed
    1. Feldman DE, Brecht M. Map plasticity in somatosensory cortex. Science. 2005;310:810–815. - PubMed
    1. Welker E, Rao SB, Dorfl J, Melzer P, van der Loos H. Plasticity in the barrel cortex of the adult mouse: effects of chronic stimulation upon deoxyglucose uptake in the behaving animal. J Neurosci. 1992;12:153–170. - PMC - PubMed
    1. Polley DB, Kvasnak E, Frostig RD. Naturalistic experience transforms sensory maps in the adult cortex of caged animals. Nature. 2004;429:67–71. - PubMed
    1. Recanzone GH, Schreiner CE, Merzenich MM. Plasticity in the frequency representation of primary auditory cortex following discrimination training in adult owl monkeys. J Neurosci. 1993;13:87–103. - PMC - PubMed

Publication types