. 2008 Mar 4;105(9):3491-6.
doi: 10.1073/pnas.0708874105. Epub 2008 Feb 27.

MHC class II stabilization at the surface of human dendritic cells is the result of maturation-dependent MARCH I down-regulation

Affiliations

MHC class II stabilization at the surface of human dendritic cells is the result of maturation-dependent MARCH I down-regulation

Aude De Gassart et al. Proc Natl Acad Sci U S A. .

Abstract

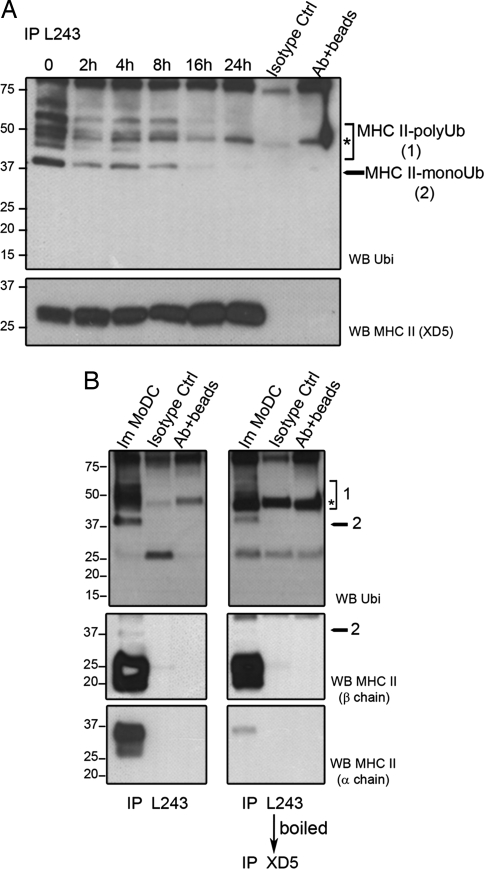
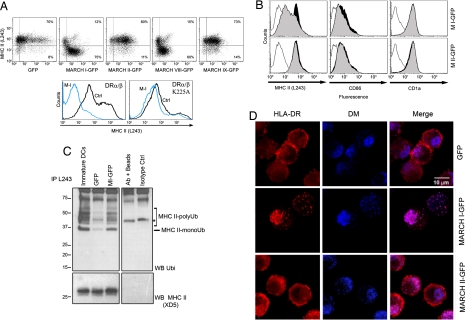
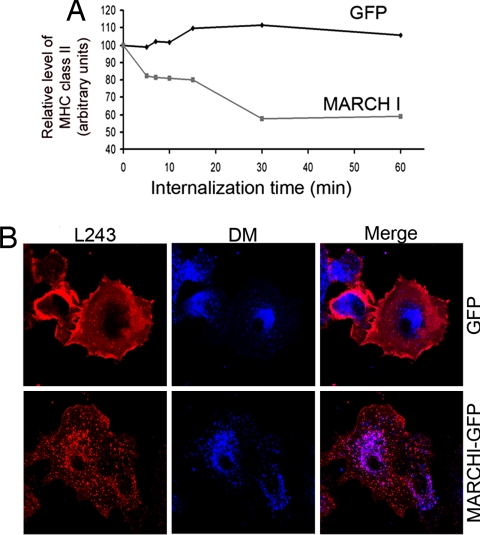
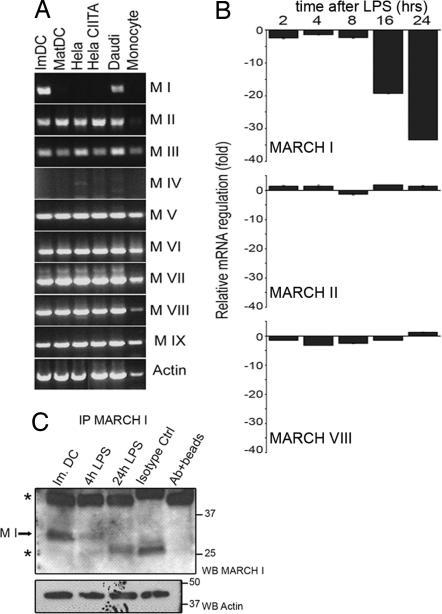
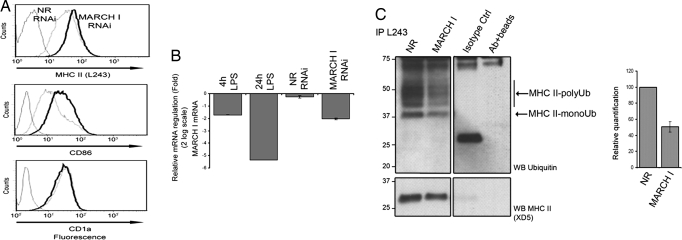
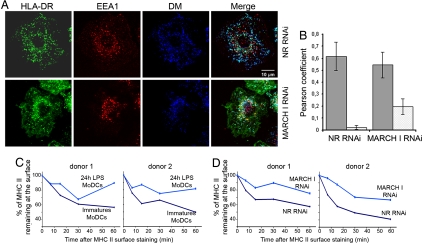
In response to Toll-like receptor ligands, dendritic cells (DCs) dramatically enhance their antigen presentation capacity by stabilizing at the cell-surface MHC II molecules. We demonstrate here that, in human monocyte-derived DCs, the RING-CH ubiquitin E3 ligase, membrane-associated RING-CH I (MARCH I), promotes the ubiquitination of the HLA-DR beta-chain. Thus, in nonactivated DCs, MARCH I induces the surface internalization of mature HLA-DR complexes, therefore reducing their stability and levels. We further demonstrate that the maturation-dependent down-regulation of MARCH I is a key event in MHC class II up-regulation at the surface of LPS-activated DCs. MARCH I is, therefore, a major regulator of HLA-DR traffic, and its loss contributes to the acquisition of the potent immunostimulatory properties of mature human DCs.


Conflict of interest statement

The authors declare no conflict of interest.

Figures

Fig. 1.
Fig. 1.
HLA-DR ubiquitination is down-regulated during MoDC maturation. (A) MoDCs were stimulated with LPS, and HLA-DR (L243) was immunoprecipitated and immunoblotted by using either anti-ubiquitin or anti-MHC II (XD5) antibodies. The asterisks represent nonspecific bands. (B) HLA-DR molecules from immature MoDCs were first immunoprecipitated with L243 antibody (left lanes). L243 immunoprecipitated material was then boiled and reimmunoprecipitated with XD5 (β-chain-specific) antibody (right lanes) before SDS/PAGE. Immunoblots of the immunoprecipitated material with anti-ubiquitin, anti-HLA-DR β-chain (XD5), or anti-HLA-DR α-chain specific antibodies are shown (Top, Middle, and Bottom, respectively). The asterisks indicate nonspecific bands.
Fig. 2.
Fig. 2.
MARCH I down-regulates surface MHC class II through ubiquitination. (A) FACS analysis of HLA-DR surface level in MARCH-eGFP (MARCH I–IX) transfected HeLa-CIITA cells (Upper) and in MARCH I-eYFP transfected HEK293T cells expressing HLA-DRα and either WT HLA-DRβ or mutant HLA-DRβ K225A (Lower). (B) FACS analysis of surface HLA-DR, CD86, and CD1a in MoDCs electroporated with either eGFP or MARCH-eGFP mRNAs. MHC II surface level is clearly decreased in MARCH I-transfected MoDCs (gray-filled curve) compared with eGFP alone (black-filled curve). Thin lines, isotype controls. (C) Immunoprecipitation of mature MHC II from MARCH I-transfected DCs followed by immunoblotting with anti-ubiquitin and anti-MHC II antibodies. The asterisk represents nonspecific bands. (D) Confocal microscopy analysis of MARCH I-eGFP transfected MoDCs. Mature MHC II molecules (L243, red) are found in HLA-DM-positive compartments (blue) in MARCH I-eGFP-transfected MoDCs, whereas they accumulate at the plasma membrane in eGFP or MARCH II-eGFP transfected cells. eGFP labeling is not shown, because its expression level is too low to allow confocal microscopy detection in MoDCs.
Fig. 3.
Fig. 3.
MARCH I overexpression promotes MHC class II late-endosomal targeting. (A) L243 antibodies were cold-bound to the surface of MARCH I-eGFP- or eGFP-transfected cells, before internalization at 37°C for different times. Cells were lysed and L243 immunoprecipitates were monitored for MHC class II β-chain by Western blot followed by digital quantification. Data are representative of three independent experiments. (B) Confocal immunofluorescence microscopy showed L243 detection (red) after 1 h of uptake in eGFP- and MARCH I-eGFP transfected MoDCs. Mature HLA-DR reached HLA-DM+ lysosomes (blue) more efficiently in MARCH I-eGFP transfected cells.
Fig. 4.
Fig. 4.
MARCH I is down-regulated during MoDCs maturation. (A) Expression profile of different MARCH mRNAs was analyzed by RT-PCR in the indicated cells. From left to right, immature MoDCs, LPS-stimulated MoDCs, HeLa, HeLa CIITA, Daudi B cells, and CD14+ monocytes are shown. (B) Expression levels of MARCH I, II, and VIII mRNA were compared among the indicated times of MoDC LPS maturation by using real-time quantitative PCR. (C) Protein levels of MARCH I were analyzed by immunoprecipitation followed by immunoblot during LPS stimulation of MoDCs. Actin from unbound fraction is shown as control.
Fig. 5.
Fig. 5.
RNA interference of MARCH I expression leads to a decrease of MHC II ubiquitination. (A) MoDCs were transfected with synthetic 21-mer-siRNAs specific for MARCH I or nonrelevant (NR) siRNA and analyzed by FACS for mature MHC II, CD86, and CD1a surface levels. MARCH I (black lines) and nonrelevant siRNA (dotted lines) transfected cells, and isotype control antibodies (gray lines) are shown. Data are representative of 10 experiments performed on different blood donors. (B) RNAi efficiency was measured by quantitative PCR comparing natural mRNA levels for MARCH I in maturing (4- and 24-h LPS) and siRNA-treated immature DCs (NR and MARCH I), relative to the expression level in iDCs. (C) Mature MHC II from siRNA-treated MoDCs was immunoprecipitated and immunoblotted by using either anti-ubiquitin or anti-MHC II antibodies. Mono- and polyubiquitinated MHC II forms are clearly decreased in MARCH I siRNA-treated cells. Western blot of one of three independent experiments used for digital quantification is shown. Quantification was performed normalizing ubiquitination level to MHC class II signal.
Fig. 6.
Fig. 6.
MARCH I depletion promotes MHC class II early-endosomal retention in MoDCs. (A) Confocal microscopy analysis of MARCH I-depleted cells. MHC II (ISCR3 mAb, green) fails to reach lysosomal compartments (blue), being retained in early endosomes (red) and at cell surface, whereas it accumulates in lysosomes in nonrelevant (NR) siRNA-treated cells. (B) Quantification of molecules colocalization using the ImageJ image analysis software and Pearson coefficient determination. A low Pearson coefficient is indicative of the absence of staining overlap. Histograms represent means ± SEM of Pearson coefficient between MHC II and HLA-DM (black) or MHC II and EEA1 (gray) on three independent experiments. (C) FACS quantification of L243 antibody uptake by immature and mature (24-h LPS-activated) MoDCs or by nonrelevant and MARCH I siRNA-transfected MoDCs (lower line). MoDCs were stained with L243 antibody for 30 min at 4°C, warmed at 37°C for indicated times, and stained with a secondary anti-mouse antibody at 4°C before FACS analysis. The kinetics of surface MHC II internalization in MARCH I siRNA-transfected cells is strikingly similar to the one observed in LPS stimulated-MoDCs. Results for two representative blood donors are shown (C and D).

References

    1. Mellman I, Steinman RM. Cell. 2001;106:255–258. - PubMed
    1. Reis e Sousa C. Nat Rev Immunol. 2006;6:476–483. - PubMed
    1. Pierre P, Turley SJ, Gatti E, Hull M, Meltzer J, Misra A, Inaba K, Steinman RM, Mellman I. Nature. 1997;388:787–792. - PubMed
    1. van Niel G, Wubbolts R, Ten Broeke T, Buschow SI, Ossendorp FA, Melief CJ, Raposo G, van Balkom BW, Stoorvogel W. Immunity. 2006;25:885–894. - PubMed
    1. Shin JS, Ebersold M, Pypaert M, Delamarre L, Hartley A, Mellman I. Nature. 2006;444:115–118. - PubMed

Publication types