. 2008 Mar 4;105(9):3616-21.
doi: 10.1073/pnas.0707920105. Epub 2008 Feb 27.

Regulation of synaptic inhibition by phospho-dependent binding of the AP2 complex to a YECL motif in the GABAA receptor gamma2 subunit

Affiliations

Regulation of synaptic inhibition by phospho-dependent binding of the AP2 complex to a YECL motif in the GABAA receptor gamma2 subunit

Josef T Kittler et al. Proc Natl Acad Sci U S A. .

Abstract

The regulation of the number of gamma2-subunit-containing GABA(A) receptors (GABA(A)Rs) present at synapses is critical for correct synaptic inhibition and animal behavior. This regulation occurs, in part, by the controlled removal of receptors from the membrane in clathrin-coated vesicles, but it remains unclear how clathrin recruitment to surface gamma2-subunit-containing GABA(A)Rs is regulated. Here, we identify a gamma2-subunit-specific Yxxvarphi-type-binding motif for the clathrin adaptor protein, AP2, which is located within a site for gamma2-subunit tyrosine phosphorylation. Blocking GABA(A)R-AP2 interactions via this motif increases synaptic responses within minutes. Crystallographic and biochemical studies reveal that phosphorylation of the Yxxvarphi motif inhibits AP2 binding, leading to increased surface receptor number. In addition, the crystal structure provides an explanation for the high affinity of this motif for AP2 and suggests that gamma2-subunit-containing heteromeric GABA(A)Rs may be internalized as dimers or multimers. These data define a mechanism for tyrosine kinase regulation of GABA(A)R surface levels and synaptic inhibition.


Conflict of interest statement

The authors declare no conflict of interest.

Figures

Fig. 1.
Fig. 1.
Characterization of the YECL motif in GABAAR γ2-subunits that binds AP2. (A) YECL-pep, but not AECL-pep, interacts directly with [35S]-labeled μ2–AP2 (residues 158–435 containing the Yxxφ motif C-terminal-binding domain). A [35S]-labeled truncated construct lacking the Yxxφ motif-binding pocket (residues 158–407) no longer binds YECL-pep. (B) YECL, but not AECL, beads associate with purified bacterially expressed His-μ2 (residues 156–435). YECL beads show reduced association with an identical His-μ2 fusion protein containing W421 mutated to A. (C and D) SPR analysis of the binding of YECL-pep to purified His-μ2 reveals a Kd of 42.2 nM. (C) Sensograms of binding His-μ2 to YECL-pep performed on a BIACORE 2000. His-μ2 was injected at concentrations from 62 nM to 2 μM (lower to upper curves) over immobilized YECL-pep. The change in SPR signal during association and dissociation is shown in colored curves. Black bars are report points set on the sensograms in the steady-state region of the curve. (D) Plot of steady-state binding levels (Req) against concentrations of μ2 and fit to steady-state affinity model. (E–J) Functional consequences of blocking γ2-subunit interaction with AP2 on inhibitory synaptic responses. (E) Plot of normalized mIPSC amplitude as a function of time in cells dialyzed with YECL-pep and control AECL-pep. YECL-pep increases mIPSC amplitude. (F and G) Representative traces (F) and cumulative plots (G) from the 3rd and 57th minutes in cells dialysed with YECL-pep. (H and I) Representative traces (H) and cumulative plots (I) from the 3rd and 57th minutes in cells dialysed with control AECL-pep. (J) Bar plot summary showing the differential effects of YECL-pep and control AECL-pep on mIPSC amplitude and frequency.
Fig. 2.
Fig. 2.
Functional effects of simultaneously targeting the β3- and γ2-subunit interactions with μ2–AP2. (A–D) Effects of coinjecting β3-pep and YECL-pep on inhibitory synaptic responses. (A and B) Representative cumulative plots (A) and traces (B) from the 3rd and 57th minutes in cells codialysed with YECL-pep and β3-pep compared with control. (C) Plot of normalized mIPSC amplitude as a function of time in cells dialyzed with YECL-pep, β3-pep, YECL-pep plus β3-pep, or control AECL-pep plus β3-phos-pep. Codialysis of β3-pep and YECL-pep causes a marked increase in mIPSC amplitude over dialysis of either peptide alone. (D) Bar plot summary showing the differential effects on mIPSC amplitude of YECL-pep and β3-pep alone or codialysed together. Asterisk indicates significant difference from control (P < 0.05, n = 6).
Fig. 3.
Fig. 3.
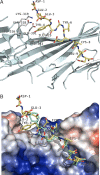
Crystal structure of the GABAAR γ2-subunit YECL-pep complexed with μ2–AP2 (157–435). (A) Ribbon diagram showing the binding site within the signal-binding domain of μ2–AP2 complexed with a peptide corresponding to GABAAR γ2-subunit residues 362–371 (gold). (B) Surface representation of the γ2 peptide-binding interface with μ2–AP2, including an overlay with the endocytic motif of EGFR (turquoise) to compare binding of the two motifs.
Fig. 4.
Fig. 4.
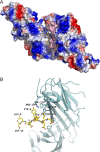
Structure of the crystallographic dimer complexed with YECL-pep. (A) Structure of the crystallographic dimer showing the elongated banana-shaped binding pocket of a single YGYECL-pep on the μ2–AP2 dimer surface with the second peptide shown in surface representation. (B) Close-up view to show direct molecular interactions between the γ2-subunit YECL-pep and the other monomer in the crystallographic dimer.
Fig. 5.
Fig. 5.
Tyrosine phosphorylation inhibits interaction with AP2 and increases surface GABAAR number. (A) Inhibition of [35S]-labeled μ2–AP2 binding to diphosphorylated (Y365 and Y367) γ2 YECL-pep beads. (B) Copurification of AP2 subunits with YECL-pep beads from brain lysate as revealed by SDS/PAGE and Coomassie blue staining. Arrows show copurified AP2 subunits (identified after mass spectrometry of the highlighted bands, arrows 1–3, representing its AP2α1, AP2α2, and μ2–AP2, respectively). A clear reduction in AP2-associated bands can be seen for a peptide phosphorylated on Y365, whereas phosphorylation of Y367 or Y365 and Y367 results in further reduction in binding. (C) Phosphorylation-dependent binding of YGYECL-pep to brain AP2 as revealed by Western blotting. (D and E) Cortical neurons were surface-biotinylated after treatment with orthovanadate to increase GABAAR phosphorylation at Y365 and Y367. (D) Representative Western blot of one experiment showing a clear increase in surface receptor number upon orthovandate treatment. (E) Bar graph showing quantified cell-surface receptor levels with and without orthovanadate treatment. Asterisk indicates significant difference from control (P < 0.05, n = 6).

References

    1. Kittler JT, McAinsh K, Moss SJ. Mol Neurobiol. 2002;26:251–268. - PubMed
    1. Essrich C, Lorez M, Benson JA, Fritschy JM, Luscher B. Nat Neurosci. 1998;1:563–571. - PubMed
    1. Crestani F, Lorez M, Baer K, Essrich C, Benke D, Laurent JP, Belzung C, Fritschy JM, Luscher B, Mohler H. Nat Neurosci. 1999;2:833–839. - PubMed
    1. Moss SJ, Gorrie GH, Amato A, Smart TG. Nature. 1995;377:344–348. - PubMed
    1. Brandon NJ, Delmas P, Hill J, Smart TG, Moss SJ. Neuropharmacology. 2001;41:745–752. - PubMed

Publication types

Associated data

LinkOut - more resources