. 2008 Apr;17(4):748-59.
doi: 10.1110/ps.073249008. Epub 2008 Feb 27.

Cu(II) organizes beta-2-microglobulin oligomers but is released upon amyloid formation

Affiliations

Cu(II) organizes beta-2-microglobulin oligomers but is released upon amyloid formation

Kwasi Antwi et al. Protein Sci. 2008 Apr.

Abstract

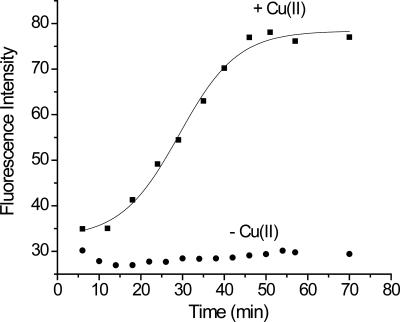
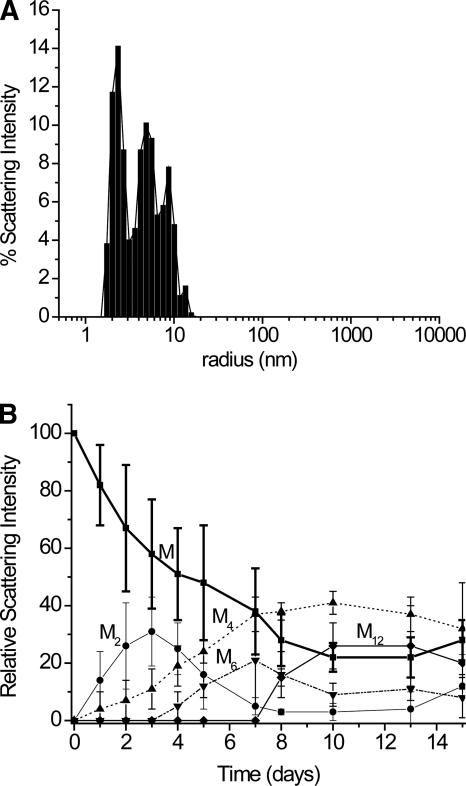
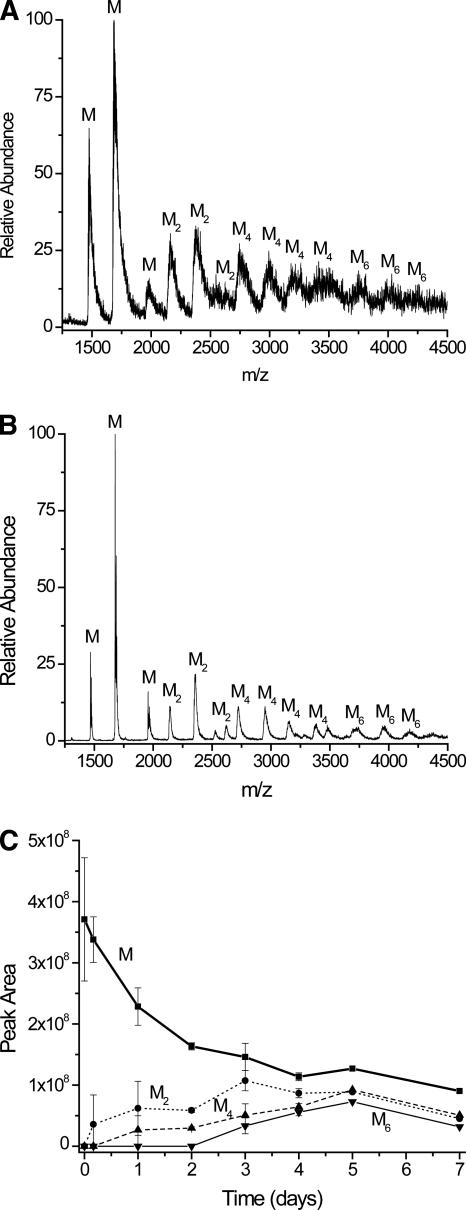
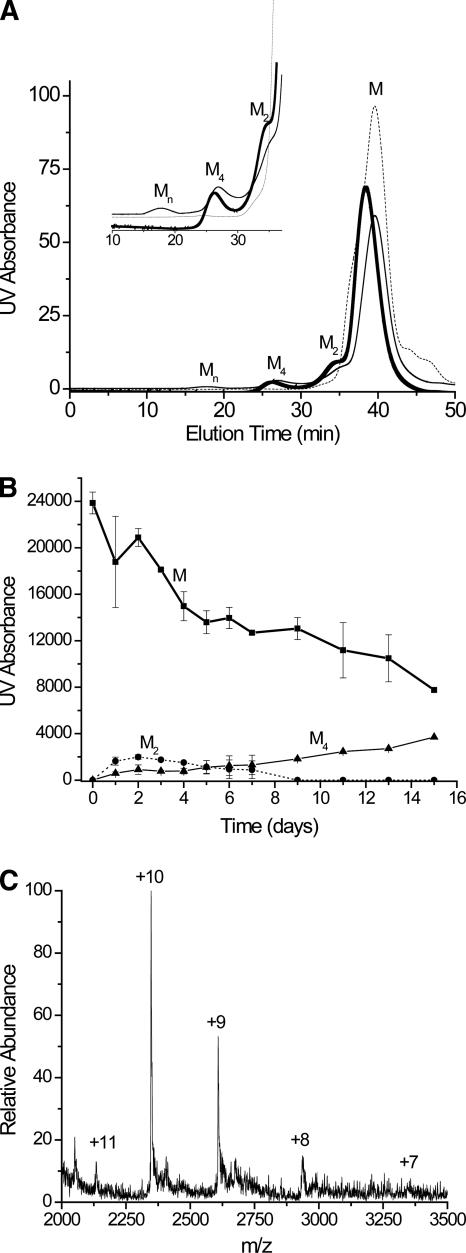
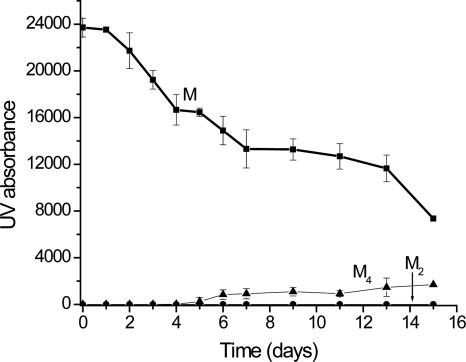
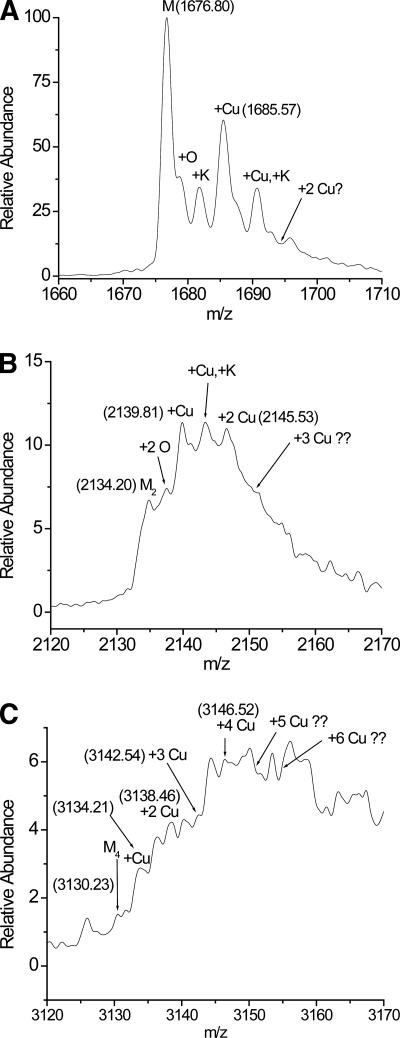
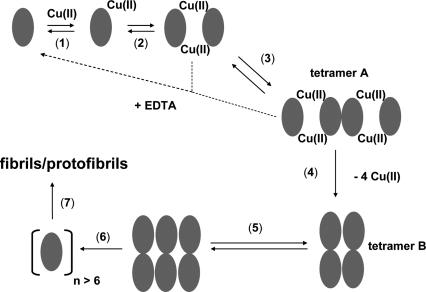
beta-2-Microglobulin (beta2m) is deposited as amyloid fibrils in the bones and joints of patients undergoing long-term dialysis treatment as a result of kidney failure. Previous work has shown that biologically relevant amounts of Cu(II) can cause beta2m to be converted to amyloid fibrils under physiological conditions in vitro. In this work, dynamic light scattering, mass spectrometry, and size-exclusion chromatography are used to characterize the role that Cu plays in the formation of oligomeric intermediates that precede fibril formation. Cu(II) is found to be necessary for the stability of the dimer and an initial form of the tetramer. The initially formed tetramer then undergoes a structural change to a state that no longer binds Cu(II) before progressing to a hexameric state. Based on these results, we propose that the lag phase associated with beta2m fibril formation is partially accounted for by the structural transition of the tetramer that results in Cu(II) loss. Consistent with this observation is the determination that the mature beta2m amyloid fibrils do not contain Cu. Thus, Cu(II) appears to play a catalytic role by enabling the organization of the necessary oligomeric intermediates that precede beta2m amyloid formation.


Figures

Figure 1.
Figure 1.
β2m amyloid formation monitored by thioflavin T (ThT) fluorescence at 483 nm. The ThT fluorescence maximum shifts from 450 nm to 483 nm upon binding to amyloid-like structures, and the fluorescence intensity at 483 nm increases in the presence of Cu (■) but remains the same in the absence of Cu (●). The trend line associated with the Cu data is from a sigmoidal fit of the data.
Figure 2.
Figure 2.
Transmission electron micrograph images obtained from β2m samples after incubation with Cu(II) for (A) 1 wk, (B) 2 wk, (C) 3 wk, and (D) 4 wk. Dimensions of images A–C are 200 nm × 325 nm, and dimensions of image D are 500 nm × 800 nm.
Figure 3.
Figure 3.
DLS analysis of β2m oligomer sizes after incubation with Cu(II). (A) Scattering intensities as a function of radii for a Cu-β2m sample incubated for 4 d. (B) Temporal progression of β2m oligomers for the first 15 d of an incubation in the presence of Cu(II). Monomers (M), dimers (M2), tetramers (M4), hexamers (M6), and dodecamers (M12) are observed. The error bars represent the standard deviations from three replicate measurements, except for the dodecamers, which were not observed in all measurements. At days 13 and 15, particles with scattering radii of >100 nm were consistently measured, but these species are not included in this plot. The lines connecting the data points are not fits of the data but are provided to simplify visualization of the data.
Figure 4.
Figure 4.
Mass spectral data for β2m incubated with Cu(II) after desalting. (A) Mass spectrum obtained after a 5-d incubation, taken under low-energy ESI source conditions. (B) Mass spectrum obtained after a 5-d incubation, taken under high-energy ESI source conditions. (C) Ion abundances of β2m oligomers obtained over time. The ion abundance of each oligomer is the sum of the peak areas for each charge state of that oligomer. To account for day-to-day variability in the ion signal from the ESI source, the mass spectrum of a 5 μM solution of ubiquitin was analyzed immediately before the incubated sample. β2m oligomer ion abundances were then normalized to the ubiquitin ion signals each day so that the oligomer ion abundances could be compared from one day to the next.
Figure 5.
Figure 5.
SEC analysis of incubated β2m sample. (A) Example chromatograms for a control [i.e., no Cu(II)] sample (dotted line), a sample incubated for 2 d with Cu(II) (thick line), and a sample incubated for 4 d with Cu(II) (thin line). The inset shows an expanded region of the chromatogram from 10 to 37 min. Monomers (M), dimers (M2), tetramers (M4), and oligomers with molecular weights above 100,000 (Mn) are observed. (B) Temporal progression of the oligomers measured by SEC. The high molecular weight oligomers (Mn) are not included in this plot. (C) SEC-ESI mass spectrum of the chromatographic peak eluting at 35 min, confirming that this compound is the β2m dimer. The charge state of each mass spectral peak is labeled.
Figure 6.
Figure 6.
SEC analysis of incubated β2m sample after the addition of EDTA. Samples were incubated for the indicated time, and just prior to analysis, an aliquot of the sample was reacted with 10 mM EDTA. The plot shows data for the monomer (M), dimer (M2), and tetramer (M4).
Figure 7.
Figure 7.
Expanded regions of the mass spectrum for a desalted solution of incubated β2m obtained under high-energy ESI conditions. (A) Expanded region around the monomer, indicating the binding of 0 and 1 Cu(II) ion. (B) Expanded region around the dimer, indicating the binding of 0, 1, and 2 Cu(II) ions. (C) Expanded region around the tetramer, indicating the binding of 0, 1, 2, 3, and 4 Cu(II) ions. In each spectrum the numbers in parentheses are the m/z ratios of the corresponding ion.
Figure 8.
Figure 8.
Proposed model for the role of Cu(II) and β2m oligomers in amyloid fibril formation.

References

    1. Bjorkman, P.J., Saper, M.A., Samraoui, B., Bennett, W.S., Strominger, J.L., Wiley, D.C. Structure of the human class-I histocompatibility antigen, HLA-A2. Nature. 1987;329:506–512. - PubMed
    1. Bush, A.I., Tanzi, R.E. The galvanization of β-amyloid in Alzheimer's disease. Proc. Natl. Acad. Sci. 2002;99:7317–7319. - PMC - PubMed
    1. Calabrese, M.F., Miranker, A.D. Formation of a stable oligomer of β-2 microglobulin requires only transient encounter with Cu(II) J. Mol. Biol. 2007;367:1–7. - PubMed
    1. Connors, L.H., Shirahama, T., Skinner, M., Fenves, A., Cohen, A.S. In vitro formation of amyloid fibrils from intact β-2-microglobulin. Biochem. Biophys. Res. Commun. 1985;131:1063–1068. - PubMed
    1. Davis, D.P., Gallo, G., Vogen, S.M., Dul, J.L., Sciarretta, K.L., Kumar, A., Raffen, R., Stevens, F.J., Argon, Y. Both the environment and somatic mutations govern the aggregation pathway of pathogenic immunoglobulin light chain. J. Mol. Biol. 2001;313:1021–1034. - PubMed

Publication types

MeSH terms