. 2008 Feb 27;28(9):2075-88.
doi: 10.1523/JNEUROSCI.5258-07.2008.

Neuron-specific expression of mutant superoxide dismutase is sufficient to induce amyotrophic lateral sclerosis in transgenic mice

Affiliations

Neuron-specific expression of mutant superoxide dismutase is sufficient to induce amyotrophic lateral sclerosis in transgenic mice

Dick Jaarsma et al. J Neurosci. .

Abstract

Mutations in superoxide dismutase (SOD1) cause amyotrophic lateral sclerosis (ALS), an adult-onset progressive paralytic disease characterized by loss of motor neurons, and cause an ALS-like disease when expressed in mice. Recent data have suggested that motor neuron degeneration results from toxic actions of mutant SOD1 operating in both motor neurons and their neighboring glia, raising the question whether mutant SOD1 expression selectively in neurons is sufficient to induce disease. Here we show that neuronal expression of mutant SOD1 is sufficient to cause motor neuron degeneration and paralysis in transgenic mice with cytosolic dendritic ubiquitinated SOD1 aggregates as the dominant pathological feature. In addition, we show that crossing our neuron-specific mutant SOD1 mice with ubiquitously wild-type SOD1-expressing mice leads to dramatic wild-type SOD1 aggregation in oligodendroglia after the onset of neuronal degeneration. Together, our findings support a pathogenic scenario in which mutant SOD1 in neurons triggers neuronal degeneration, which in turn may facilitate aggregate formation in surrounding glial cells.


Figures
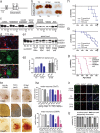
Figure 1.
Figure 1.
Neuron-specific G93A–SOD1 expression is sufficient to cause motor neuron disease in transgenic mice. a, b, Pronuclear injections of the Thy1.2 expression cassette with G93A–mutant hSOD1 cDNA (a) yielded two mouse lines (T1, T3) with high G93A–SOD1 expression in the spinal cord as determined by immunoperoxidase histochemistry with an hSOD1-specific antibody (b). c, Western blot with human SOD1-preferring antibody (SOD100) shows that T1 and T3 mice express G93A–SOD1 throughout the CNS but not in other tissues. d, Confocal immunofluorescence of T1T3 mouse spinal cord section shows that hSOD1 immunoreactivity does not codistribute with astroglial (GFAP) and oligodendroglial (αB-crystallin) staining. e, Representative blot (e1) and bar graph (e2) of quantitative Western blot analysis of mutant SOD1 expression in spinal cord of hemizygote and homozygote T3 mice compared with the ubiquitous G93A–SOD1-expressing G1del mice. Values represent means ± SE; n = 3. f, Age of disease onset and end stage of T1T3 (f1) and T3T3 (f2) neuron-specific G93A–SOD1 mice. g, Age of disease onset and end stage of neuron-specific G93A–SOD1 mice crossed into ubiquitously wild-type hSOD1-expressing mice. h, End-stage T3T3 and G1del mice show similar loss of motor neurons, accumulation of argyrophylic neuronal debris (Ag staining, h1), and astroglial expression of Hsp25 in ventral spinal cord. Motor neurons were counted in lumbar L4 sections immunoperoxidase stained for ChAT, which is present in all motor neurons, or CGRP, which is expressed in a subset of large motor neurons (h2). Values in the bar graphs represent means ± SE; n = 3. ***p < 0.001 compared with nontransgenic mice and presymptomatic transgenic mice, one-way ANOVA with Tukey's multiple comparison test. i, Analysis of neuromuscular denervation in sections of medial gastrocnemius muscle stained with α-bungarotoxin (α-BTX, motor endplates), anti-VAChT (motor nerve endings), and α-hSOD1 (axons and nerve ending). Data are shown as percentage of endplates classified as innervated, denervated, or partially denervated. Scale bars: d, 10 μm; h1, 250 μm.
Figure 2.
Figure 2.
End-stage neuron-specific G93A–SOD1 mice show reduced total mutant SOD1 expression and the accumulation of detergent-insoluble and multimeric SOD1 species. a–e, hSOD1-immunoperoxidase staining showing distribution and relative intensity of hSOD1 in the C7 spinal cord sections from hemizygote and homozygote T3 mice as well as G1del mice. Note that, spinal cord specimens were embedded in a single gelatin block and sectioned and stained together to avoid variability in staining. Antibody concentration (sheep anti-SOD1; 1:10,000) and staining conditions were chosen to maximize differences between hemizygote and homozygote T3 mice (compare b with c) showing a twofold difference in hSOD1 expression as determined by Western blot (Fig. 1e). Under these conditions, staining of G1del spinal cord is saturated (e), consistent with higher mutant SOD1 expressions levels (Fig. 1e). Note that end-stage T3T3 mice (d) compared with young presymptomatic T3T3 mice show reduced hSOD1 immunoreactivity in the ventral horn (VH) and the intermediate zone (IZ), but equal amounts of hSOD1 immunoreactivity in the dorsal horn (DH), consistent with the occurrence of neuronal degeneration in the ventral horn and the intermediate zone. f, Western blot analysis of G93A–SOD1 expression in NP-40-insoluble fraction (P2), showing the accumulation of insoluble G93A–SOD1 in spinal cord of both neuron-specific and ubiquitous G93A–SOD1 mice (f1). Prolonged exposure revealed the presence of multimeric SOD1 species in the insoluble fraction (arrows in f2). Note in f2 that the lanes of T3T3 mice were exposed longer than the other lanes to obtain comparable signal of multimeric SOD1 species.
Figure 3.
Figure 3.
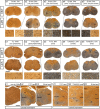
Distribution of argyrophylic degeneration in neuron-specific and ubiquitous G93A–SOD1 mice correlate with symptoms. Silver degeneration staining visualizing the distribution of neuronal degeneration in ubiquitous (G1del) and neuron-specific (T3T3, T1T3, T3hSOD1) G93A–SOD1 mouse models. Presymptomatic mice show no or very little argyrophylic staining (a1, b1, b2, c1), but levels of argyrophylic staining increase in parallel with the severity of symptoms. Argyrophylic staining accumulates in the spinal cord ventral horn as well in supraspinal CNS regions, including the medullary (MedRF in c2, c3), pontine and mesencephalic reticular formation (MesRF in D1), and the zona incerta (ZI in d1–d3). In mice with focal asymmetric symptoms, also argyrophylic staining is distributed focally in the part of the spinal cord corresponding to the affected limb. For instance, a G1del mouse killed shortly after the onset of motor problems in its left hindlimb selectively shows a high level of argyrophylic degeneration in the left lumbar spinal cord and low staining levels in the right lumbar and cervical cord (a2). Animals killed in later phases of disease also show staining in the contralateral side and at cervical levels (a3, a4). Mice with forelimb onset may reach end-stage disease with relatively preserved hindlimb function and concomitant low levels of neuronal degeneration at lumbar levels (a5). T1T3, T3T3, and T3hSOD1 mice never showed focal symptom onset and progression of disease and accordingly show similar amounts of argyrophylic staining between left and right, and lumbar and cervical segments (b2–b5). Section in c and d correspond to plates 89 (c1, c3), 85 (c2), 54 (d1), 48 (d2), and 44 (d3) of the mouse brain atlas of Paxinos and Franklin (2001). CA3, CA3 hippocampal subfield; Cb, cerebellum; DG, dentate gyrus; Po, posterior thalamic nuclei; Sol, nucleus of the solitary tract; Sp5, spinal trigeminal nucleus; VPM, ventral posteromedial thalamic nucleus. Scale bars: b1, c1, 500 μm.
Figure 4.
Figure 4.
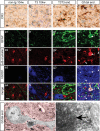
Neuron-specific G93A–SOD1 mice, like ubiquitous G93A mice, show signs of microgliosis and astrogliosis, but do not develop glial SOD1 aggregates. a–d, Murine CR3 staining of resting and activated microglia (brown) in thionin counterstained (blue) lumbar L4–ventral horn showing the presence of activated microglia (arrows in c, d) in spinal cord of end-stage neuron-specific (T3T3) and ubiquitous (G1del) G93A–SOD1 mice. e–h, Triple-labeling confocal immunofluorescence of GFAP, αB-crystallin, and hSOD1 in lumbar spinal cord sections showing that end-stage T3T3 mice (g), like end-stage G1del mice (h), show increased GFAP immunoreactivity indicative of astrogliosis (g1, h1) but, unlike G1del mice, do not show increased αB-crystallin immunoreactivity (g2, h2). Intensely αB-crystallin labeled structures in G1del mice usually are strongly immunoreactive for transgenic human mutant SOD1 (arrows and arrowheads in h) and occasionally codistribute for GFAP (arrows in h). αB-Crystallin- and hSOD1-positive, but GFAP-negative, structures (arrowheads in h) represent SOD1 aggregates in oligodendrocytes (see also Figs. 5, 7). Asterisks in c3 indicate a vacuolated mitochondrion, which is outlined by a halo of intense hSOD1 immunoreactivity (see also Jaarsma et al., 2001). Note in g that end-stage T3T3 mice show loss of hSOD1 in parallel with increased GFAP staining, consistent with neuronal degeneration and neuron-specific expression of mutant SOD1. Also note that, because of higher hSOD1 levels in G1del mice, the hSOD1 signal in h3 has been scanned at lower detector sensitivity compared with e3–g3 to avoid saturation of the image. i, αB-Crystallin immunoperoxidase electron micrograph of an astroglial SOD1 aggregate in end-stage G1del mouse. The astrocyte with the aggregate is outlined by color coding the surrounding neuropil (Nu). Astroglial SOD1 aggregates consist of disorganized filamentous material, which, in accord with confocal immunofluorescent images (arrow in h), are immunoreactive for αB-crystallin (arrow in i2). Note GFAP filaments right from dashed line in i2. Scale bars: a, 20 μm; e4, 10 μm; i1, 3 μm.
Figure 5.
Figure 5.
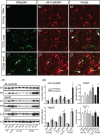
Neuron-specific G93A–SOD1 mice do not show increased levels of insoluble αB-crystallin and αB-crystallin-positive ubiquitinated structures. a–c, Double-labeling confocal immunofluorescence shows that ubiquitin immunoreactivity in end-stage neuron-specific G93A–SOD1 mice (T3T3) never codistributes with αB-crystallin (arrowheads in b). In contrast, ubiquitous G93A–SOD1 (G1del) mice frequently show intense αB-crystallin labeling of ubiquitinated structures (arrows in c). These αB-crystallin-positive ubiquitinated structures represent glial ubiquitinated SOD1 aggregates (see also Figs. 4, 7). d, Western blot analysis of the small heat shock proteins αB-crystallin and Hsp25 and the astroglial proteins GFAP and GLT1 in total spinal cord homogenate (S1) and 0.5% NP-P40-insoluble pellet (P2) of nontransgenic, T3, T3T3, and G1del mice. Note that insoluble αB-crystallin levels are strongly increased in symptomatic G1del mice. End-stage T3T3 show a small increase of insoluble αB-crystallin levels, which was similar to increased insoluble αB-crystallin levels in aged nontransgenic and T3 mice. Large increases of total and insoluble Hsp25 occurred in both end-stage G1del and T3T3 mice, consistent with astroglial induction of Hsp25 expression as shown in Figure 1 h. End-stage G1del and T3T3 mice also showed increased GFAP and a trend (nonsignificant; one-way ANOVA) of reduced GLT-1 expression. Values represent means ± SE; n = 3. *p < 0.05, **p < 0.01, ***p < 0.001 compared with 20-week-old nontransgenic mice; #p < 0.05 compared with 104-week-old nontransgenic mice (one-way ANOVA, Tukey's multiple comparison test).
Figure 6.
Figure 6.
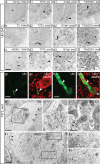
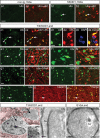
Dendritic ubiquitinated SOD1 aggregates are the dominant pathological feature preceding motor neuron degeneration in neuron-specific G93A–SOD1 mice. a–f, Immunoperoxidase labeling of ubiquitin immunoreactivity in the ventral horn (VH) of L4 spinal cord sections of neuron-specific G93A–SOD1 mice (d, T3T3), ubiquitous G93A–SOD1 mice (e, G1del), wild-type hSOD1-overexpressing mice (c), and double-transgenic T3hSOD1 mice (f). In T3T3 mice, ubiquitin immunoreactivity is associated with neurite-like structures (arrowheads in d) and neuronal somata with a relatively modest increase in the number of labeled structures throughout disease progression. In G1del mice, ubiquitin immunoreactivity is predominantly associated with neurite-like structures in early stages of disease (arrowheads in e1, e2), but the amount of ubiquitin-immunoreactive structures increases progressively in late phases of disease attributable to the appearance of glial ubiquitinated SOD1 aggregates (small arrow in e3) (see also Figs. 4, 5). Also T3hSOD1 mice show neuritic ubiquitin immunoreactivity in presymptomatic stages, but, from symptom onset, T3hSOD1 mice show dramatic high levels of ubiquitin immunoreactivity resulting from oligodendrocytic SOD1 aggregates, which have a dot-like appearance in immunoperoxidase-stained sections (small arrows in f2, f3) (see also Fig. 7). In old hSOD1 mice, ubiquitin labeling was exclusively associated with these dot-like oligodendrocyte aggregates (arrows in c) and never occurred in neuronal profiles. Ubiquitinated structures were never observed in 2-year-old nontransgenic and hemizygote T3 mice. vlfu, Ventrolateral funiculus. g, h, Double-labeling confocal immunofluorescence shows that neuritic ubiquitin immunoreactivity in T3T3 mice codistributes with MAP2 immunoreactivity consistent with a dendritic localization. Note in h that the motor neuron with ubiquitin immunoreactivity in the proximal dendrite has a flattened eccentric nucleus suggestive of compromised health. i–k, Postembedding immunogold electron microscopy of ubiquitin and transgenic human SOD1 in aggregates in distal (h, i) and proximal (j) dendrites. Dendritic aggregates predominantly consisted of disorganized filaments (arrowheads in i2, j, k3). Note the presence of mitochondria (m) in close proximity of the aggregates in i and j. Aggregates in proximal dendrites show a higher level of aggregated material in the center (k1, k2) and often contain high levels of vesicular structures at the periphery (j). Note that the postembedding immunogold procedure is relatively inefficient compared with immunoperoxidase histochemistry and immunofluorescence methods producing labeling only in areas with high hSOD1 and ubiquitin concentrations. Also note that synapses (arrows in i1, j, k1) and mitochondria (m) have a normal appearance in the dendritic profiles with aggregates. Scale bars: c, 50 μm; g1, h1, 10 μm; i1, j, k1, 500 nm.
Figure 7.
Figure 7.
Neuron-specific expression of G93A–SOD1 in ubiquitous wild-type hSOD1-overexpressing transgenic mice triggers massive wild-type hSOD1 aggregation in oligodendrocytes. a–i, Double-labeling confocal immunofluorescence showing high-level ubiquitinated structures with a diameter up to 10 μm in the spinal cord of symptomatic T3hSOD1 mice. These ubiquitinated structures are immunoreactive for αB-crystallin (arrow in c, d) and hSOD1 (arrow in i) and surrounded by the oligodendrocyte marker RIP (f) and do not codistribute with astroglial (GFAP), microglial (CR3), and somatodendritic neuronal (MAP2, e) markers. In addition to these oligodendrocyte aggregates, T3hSOD1 show infrequent αB-crystallin-negative ubiquitinated structures (arrowhead in c) that are immunoreactive for MAP2 (arrowhead in e) consistent with a somatodendritic distribution. Also wild-type hSOD1 mice that do not express the T3 transgene also develop oligodendrocyte aggregates albeit at advanced age (>70 weeks) and at much lower numbers (arrow in b) (see also Fig. 6c,f). j–l, Standard (j) and postembedding immunogold electron microscopy of oligodendrocyte aggregates (k, l) showing that oligodendrocyte aggregates consist of 11- to 14-nm-thick randomly oriented filaments. Scale bars: a1, g1, 20 μm; d1, f1, 10 μm; j–l, 500 nm.

References

    1. Andersen PM, Sims KB, Xin WW, Kiely R, O'Neill G, Ravits J, Pioro E, Harati Y, Brower RD, Levine JS, Heinicke HU, Seltzer W, Boss M, Brown RH., Jr Sixteen novel mutations in the Cu/Zn superoxide dismutase gene in amyotrophic lateral sclerosis: a decade of discoveries, defects and disputes. Amyotroph Lateral Scler Other Motor Neuron Disord. 2003;4:62–73. - PubMed
    1. Arai T, Hasegawa M, Akiyama H, Ikeda K, Nonaka T, Mori H, Mann D, Tsuchiya K, Yoshida M, Hashizume Y, Oda T. TDP-43 is a component of ubiquitin-positive tau-negative inclusions in frontotemporal lobar degeneration and amyotrophic lateral sclerosis. Biochem Biophys Res Commun. 2006;351:602–611. - PubMed
    1. Arima K, Ogawa M, Sunohara N, Nishio T, Shimomura Y, Hirai S, Eto K. Immunohistochemical and ultrastructural characterization of ubiquitinated eosinophilic fibrillary neuronal inclusions in sporadic amyotrophic lateral sclerosis. Acta Neuropathol (Berl) 1998;96:75–85. - PubMed
    1. Beers DR, Henkel JS, Xiao Q, Zhao W, Wang J, Yen AA, Siklos L, McKercher SR, Appel SH. Wild-type microglia extend survival in PU. 1 knockout mice with familial amyotrophic lateral sclerosis. Proc Natl Acad Sci USA. 2006;103:16021–16026. - PMC - PubMed
    1. Bergemalm D, Jonsson PA, Graffmo KS, Andersen PM, Brannstrom T, Rehnmark A, Marklund SL. Overloading of stable and exclusion of unstable human superoxide dismutase-1 variants in mitochondria of murine amyotrophic lateral sclerosis models. J Neurosci. 2006;26:4147–4154. - PMC - PubMed

Publication types

MeSH terms