. 2008 Feb 28:9:104.
doi: 10.1186/1471-2164-9-104.

Reliability and applications of statistical methods based on oligonucleotide frequencies in bacterial and archaeal genomes

Affiliations

Reliability and applications of statistical methods based on oligonucleotide frequencies in bacterial and archaeal genomes

Jon Bohlin et al. BMC Genomics. .

Abstract

Background: The increasing number of sequenced prokaryotic genomes contains a wealth of genomic data that needs to be effectively analysed. A set of statistical tools exists for such analysis, but their strengths and weaknesses have not been fully explored. The statistical methods we are concerned with here are mainly used to examine similarities between archaeal and bacterial DNA from different genomes. These methods compare observed genomic frequencies of fixed-sized oligonucleotides with expected values, which can be determined by genomic nucleotide content, smaller oligonucleotide frequencies, or be based on specific statistical distributions. Advantages with these statistical methods include measurements of phylogenetic relationship with relatively small pieces of DNA sampled from almost anywhere within genomes, detection of foreign/conserved DNA, and homology searches. Our aim was to explore the reliability and best suited applications for some popular methods, which include relative oligonucleotide frequencies (ROF), di- to hexanucleotide zero'th order Markov methods (ZOM) and 2.order Markov chain Method (MCM). Tests were performed on distant homology searches with large DNA sequences, detection of foreign/conserved DNA, and plasmid-host similarity comparisons. Additionally, the reliability of the methods was tested by comparing both real and random genomic DNA.

Results: Our findings show that the optimal method is context dependent. ROFs were best suited for distant homology searches, whilst the hexanucleotide ZOM and MCM measures were more reliable measures in terms of phylogeny. The dinucleotide ZOM method produced high correlation values when used to compare real genomes to an artificially constructed random genome with similar %GC, and should therefore be used with care. The tetranucleotide ZOM measure was a good measure to detect horizontally transferred regions, and when used to compare the phylogenetic relationships between plasmids and hosts, significant correlation (R2 = 0.4) was found with genomic GC content and intra-chromosomal homogeneity.

Conclusion: The statistical methods examined are fast, easy to implement, and powerful for a number of different applications involving genomic sequence comparisons. However, none of the measures examined were superior in all tests, and therefore the choice of the statistical method should depend on the task at hand.


Figures

Figure 1
Figure 1
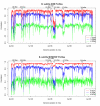
Random genome compared to sequenced bacterial genomes. Comparisons between 581 sequenced bacterial and archaeal chromosomes and plasmids with a random 5.3 mbp DNA sequence with 50% GC content. The comparisons were performed to test the reliability of different oligonucleotide based statistical measures consisting of di- to hexanucleotide ZOMs, tetranucleotide ROFs and MCMs. The chromosomes and plasmids, represented as points along the horizontal axis, were correlated with the random DNA sequence, with the corresponding correlation scores on the vertical axis, and sorted by increasing AT content from left to right. Higher correlation scores means better match. In (A) all chromosomes and plasmids were compared using di- to hexanucleotide ZOMs, while in (B) they were compared using tetranucleotide ROFs and MCMs, with tetranucleotide ZOMs included as reference. It can be observed that dinucleotide ZOMs achieve surprisingly high correlation scores (A) while hexanucleotide ZOMs show no correlation at all. Tetranucleotide ROFs (B) achieves slightly higher correlation values than both tetranucleotide MCMs and ZOMs.
Figure 2
Figure 2
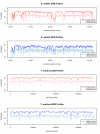
B. subtilis tetranucleotide MCM, ROF, and ZOM autocorrelation profiles. Di-, tetra- and hexanucleotide ZOM (top), respectively red, green and blue lines, together with tetranucleotide MCM and ROF (below), respectively green and red lines, based autocorrelation profiles of B. subtilis. Autocorrelation scores (vertical axis) are obtained with 5 kbp sliding windows, overlapping every 2.5 kbp, correlated with mean genomic values. The horizontal axis represents chromosomal position, with each point spanning 5 kbp. Average autocorrelation scores drop progressively for di- to hexanucleotide ZOMs, presumably due to lower departure values between observed and expected tetranucleotide frequencies caused by small sliding windows. ZOM and ROF based profiles appear similar, but the former appear more detailed. Although the hexanucleotide ZOM and tetranucleotide MCM measures had similar average autocorrelation scores, the latter can be observed to vary considerably more than the former. All marked dots represent presumed horizontally acquired DNA, and the two largest dips located close to 2.2 mbp and 2.7 mbp are known prophages.
Figure 3
Figure 3
T. maritima tetranucleotide MCM, ROF, and ZOM autocorrelation profiles. Di-, tetra- and hexanucleotide ZOMs (top), respectively red, green and blue lines, together with tetranucleotide MCM and ROF (bottom), respectively green and red lines, based autocorrelation profiles of T. maritima. Autocorrelation scores (vertical axis) were obtained with 5 kbp sliding windows, overlapping every 2.5 kbp, correlated with mean genomic values. The horizontal axis represents chromosomal position, with each point spanning 5 kbp. All large dips, except the one found at position 190 kbp, which was found to be 16S, 23S and 5S rRNA genes, are presumed to be horizontally transferred. The marked dips in the tetranucleotide ZOM profiles are part of a presumed horizontally acquired ABC transport system. It can be observed from the Figure that the profile based on tetranucleotide ROFs resembles the ZOM profiles, but that some dips are less visible. The low average autocorrelation value in the tetranucleotide MCM profile is assumed to be caused by lower departure values between observed and expected tetranucleotide frequencies due to small sliding window size. Although many of the large dips found in the other measures were absent in the MCM profile, irregularities (marked dots) were observed in the MCM profile that were not easily detectable with the other measures. Looking at the di-, tetra- and hexanucleotide ZOM profiles, progressively more fluctuations can be observed for increasing oligonucleotide size while average autocorrelation scores drop.
Figure 4
Figure 4
B. subtilis and T. maritima hexanucleotide ZOM and tetranucleotide MCM autocorrelation profiles. Hexanucleotide ZOM (red) and tetranucleotide MCM (blue) based autocorrelation profiles. Autocorrelation scores (vertical axis) were obtained with 5 kbp and 20 kbp sliding windows, overlapping every 2.5 kbp and 5 kbp, respectively, and correlated with mean genomic values. The horizontal axis represents genome position and each point of the red and blue curves spans 5 kbp, while each point of the light blue and pink curves spans 20 kbp. It can be observed from the graphs that increasing sliding window size increases average autocorrelation score for both hexanucleotide ZOM and tetranucleotide MCM profiles, but reduces detail. The tetranucleotide MCM measure (blue and light blue curves) had, in general, larger variance for the genomes tested than the hexanucleotide ZOM measure (red and pink curves), implying that the MCM measure was more sensitive to genomic changes.
Figure 5
Figure 5
Homology search/alignment based on heptanucleotide ROFs in Mycobacterium leprae. Homology search based on heptanucleotide ROFs in M. leprae, using a 1 kbp non-overlapping sliding window compared with a vector consisting of heptanucleotide frequencies taken from 5 kbp of T. maritima DNA consisting of 16S, 23S and 5S rRNA genes. The horizontal axis represents nucleotide positions, each point spanning 1 kbp, in the M. leprae chromosome, while the vertical axis gives correlation values based on comparisons between the sliding window and the T. maritima DNA vector. The marked peak indicates the closest hit, containing corresponding rRNA genes in M. leprae. Although M. leprae is very distantly related to T. maritima (hexanucleotide ZOM score of 0.13) its rRNA genes could be detected using DNA from the corresponding T. maritima rRNA genes with the search method based on ROFs.
Figure 6
Figure 6
Plasmid-hosts comparisons based on the tetranucleotide ZOM measure. Plasmids sized 10 kbp and larger were compared with their corresponding archaeal and bacterial hosts. Plasmid-host correlation values (black dots) were then compared with host average autocorrelation values (expected plasmid-host correlation score, red line) based on 40 kbp sliding windows and tetranucleotide ZOMs. The green line represents lower autocorrelation values, i.e. average autocorrelation values subtracted by standard deviation, while the blue and cyan lines show host and plasmid GC content respectively. The vertical axis represents host bacteria average autocorrelation values (red line), host GC content (blue line), plasmid GC content (cyan), and plasmid-host correlations (black dots). All bacteria and archaea with corresponding plasmids are distributed as points along the horizontal axis and sorted by increasing plasmid GC content from left to right. From the graph it can be observed that GC rich bacteria were more similar to their plasmids in terms of tetranucleotide ZOMs than AT rich bacteria. It can also be noticed that average autocorrelation scores (expected plasmid-host correlation scores) seems to increase and become less volatile for GC rich bacteria than their AT rich counterparts.

References

    1. Coenye T, Gevers D, Van de PY, Vandamme P, Swings J. Towards a prokaryotic genomic taxonomy. FEMS Microbiol Rev. 2005;29:147–167. doi: 10.1016/j.femsre.2004.11.004. - DOI - PubMed
    1. Foerstner KU, von MC, Hooper SD, Bork P. Environments shape the nucleotide composition of genomes. EMBO Rep. 2005;6:1208–1213. doi: 10.1038/sj.embor.7400538. - DOI - PMC - PubMed
    1. Chen LL, Zhang CT. Seven GC-rich microbial genomes adopt similar codon usage patterns regardless of their phylogenetic lineages. Biochem Biophys Res Commun. 2003;306:310–317. doi: 10.1016/S0006-291X(03)00973-2. - DOI - PubMed
    1. Lobry JR, Necsulea A. Synonymous codon usage and its potential link with optimal growth temperature in prokaryotes. Gene. 2006;385:128–136. doi: 10.1016/j.gene.2006.05.033. - DOI - PubMed
    1. Musto H, Naya H, Zavala A, Romero H, varez-Valin F, Bernardi G. Genomic GC level, optimal growth temperature, and genome size in prokaryotes. Biochem Biophys Res Commun. 2006;347:1–3. doi: 10.1016/j.bbrc.2006.06.054. - DOI - PubMed

LinkOut - more resources