. 2008 Mar;28(3):324-34.
doi: 10.1016/j.immuni.2008.01.008. Epub 2008 Feb 28.

Crossreactive T Cells spotlight the germline rules for alphabeta T cell-receptor interactions with MHC molecules

Affiliations

Crossreactive T Cells spotlight the germline rules for alphabeta T cell-receptor interactions with MHC molecules

Shaodong Dai et al. Immunity. 2008 Mar.

Abstract

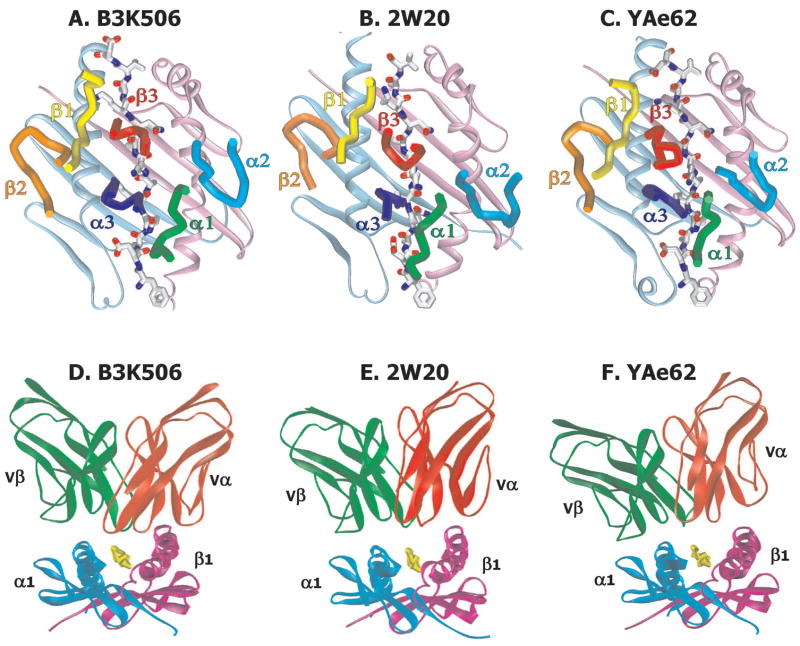
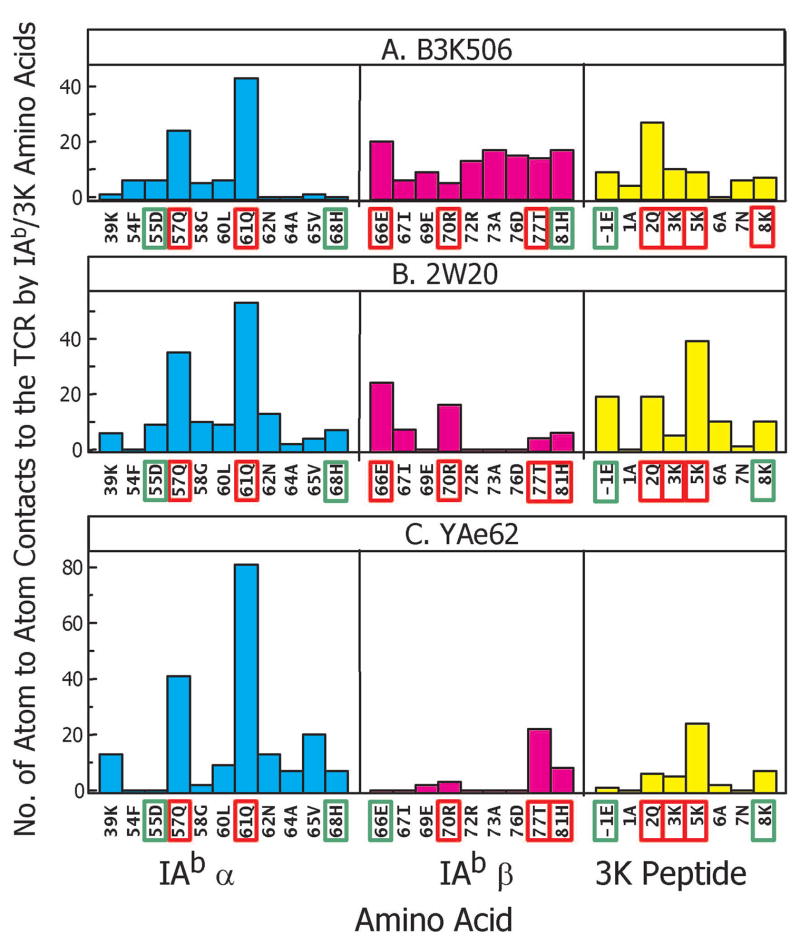
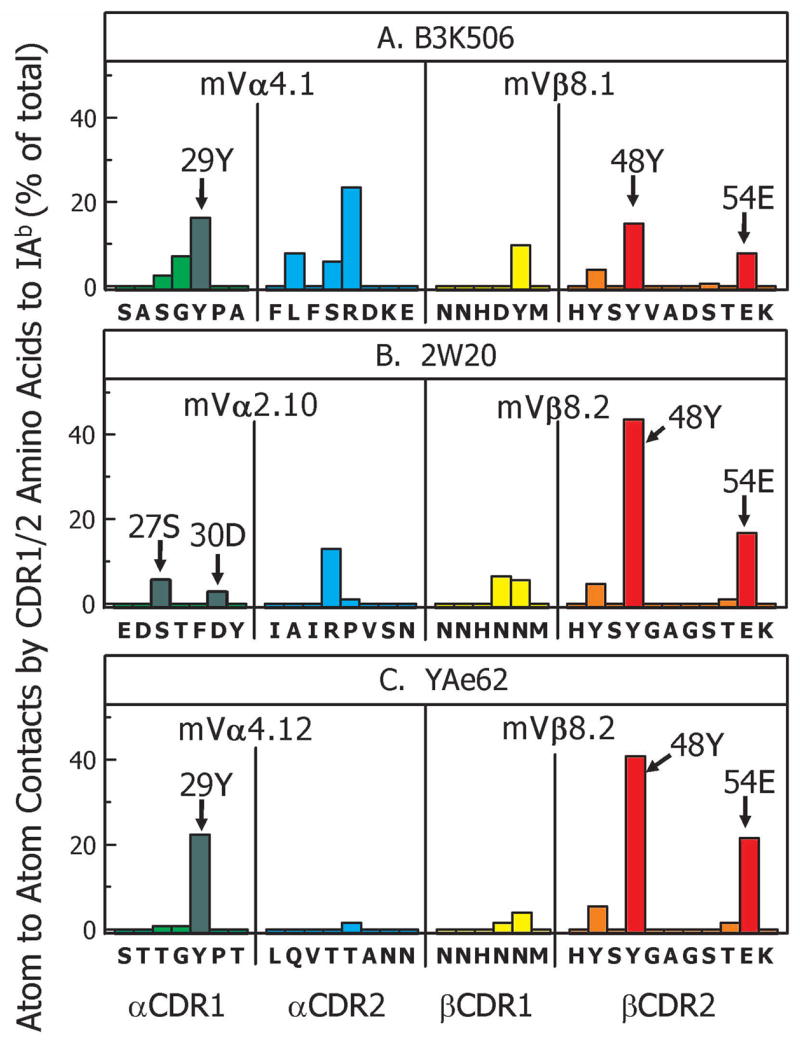
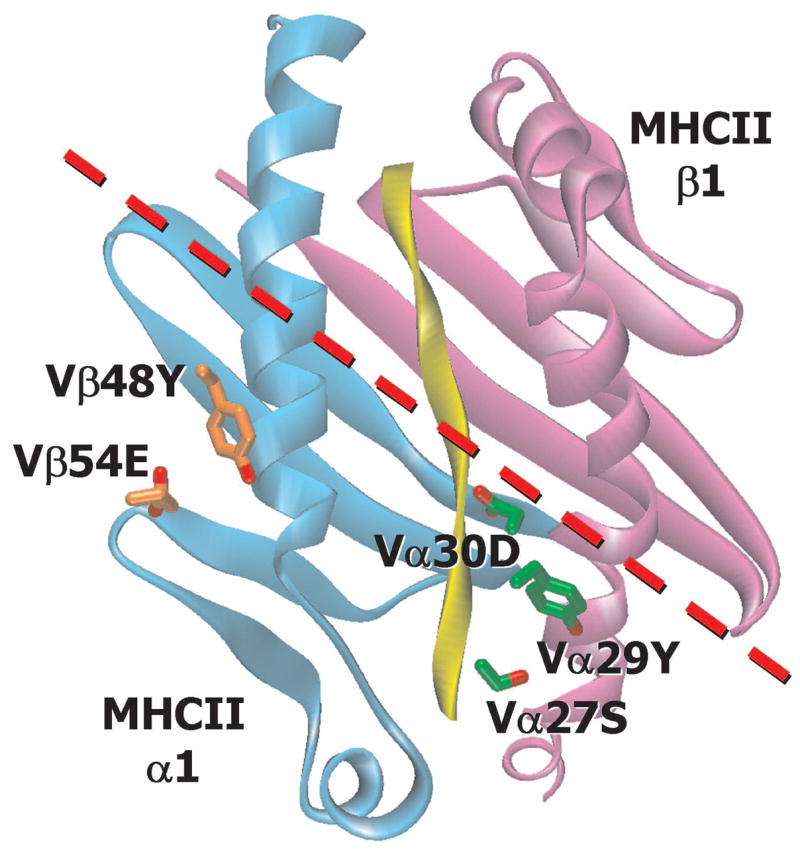
To test whether highly crossreactive alphabeta T cell receptors (TCRs) produced during limited negative selection best illustrate evolutionarily conserved interactions between TCR and major histocompatibility complex (MHC) molecules, we solved the structures of three TCRs bound to the same MHC II peptide (IAb-3K). The TCRs had similar affinities for IAb-3K but varied from noncrossreactive to extremely crossreactive with other peptides and MHCs. Crossreactivity correlated with a shrinking, increasingly hydrophobic TCR-ligand interface, involving fewer TCR amino acids. A few CDR1 and CDR2 amino acids dominated the most crossreactive TCR interface with MHC, including Vbeta8 48Y and 54E and Valpha4 29Y, arranged to impose the familiar diagonal orientation of TCR on MHC. These interactions contribute to MHC binding by other TCRs using related V regions, but not usually so dominantly. These data show that crossreactive TCRs can spotlight the evolutionarily conserved features of TCR-MHC interactions and that these interactions impose the diagonal docking of TCRs on MHC.


Figures

Figure 1
Figure 1. Orientation of the TCRs on their IAb/3K ligand
For the A) B3K506, B) 2W20 and C) YAe62 TCRs bound to IAb/3K, a top view of the IAb α1 and β1 domains are shown as ribbons colored light cyan and light magenta respectively with the bound 3K peptide shown as a wireframe with CPK coloring. For each complex the six TCR CDR loops are shown as tubes colored as follows: αCDR1 - green; αCDR2 - dark cyan; αCDR3 - blue; βCDR1 - yellow; βCDR2 - orange; βCDR3 - red. For the D) B3K506, E) 2W20 and F) YAe62 TCRs bound to IAb/3K, views are shown looking down the IAb peptide binding groove from the peptide N-terminus. Ribbon representations of the IAb α1 and β1 domains (cyan and magenta respectively) and TCR Vα and Vβ domains (red and green) are shown. The 3K peptide is represented with a yellow tube.
Figure 2
Figure 2. The footprint of the TCRs on IAb/3K
The areas of contact on the IAb/3K ligand are shown for the A) B3K506, B) 2W20 and C) YAe62 TCRs. In each case, the water accessible surface of the α1/β1/peptide portions of IAb/3K is shown, viewed looking directly at the areas of TCR contact. The portion of the IAb/3K surface in contact with the TCRs is colored as follows: that from atoms in α1, dark cyan; from β1, dark magenta; from the peptide, dark yellow. The rest of the surface is colored as follows: α1 helix, light cyan; β1 helix, light magenta; peptide light yellow; the rest of α1 and β1, white.
Figure 3
Figure 3. IAb/3K atom to atom contacts with the TCRs and the correlation with IAb/3K mutational data
The figure shows the number of atom to atom contacts between the A) B3K506, B) 2W20 or C) YAe62 TCR and individual IAb/3K amino acids within the α chain (cyan), β chain (magenta) and peptide (yellow) portion of the ligand. Data are shown for all IAb/3K amino acids that contact the TCR in any of the structures. The IAb/3K non-alanine amino acids that were previously (Huseby et al., 2006) subjected to mutational analysis are high-lighted with a rectangle. A green rectangle indicates that when this position was mutated to alanine and tested for TCR binding there was an increase in ΔΔG of ≤ 0.8 kcal/mole. A red rectangle indicates an increase of >0.8 kcal/mole.
Figure 4
Figure 4. Crossreactive TCRs use only a few amino acids in CDR1/CDR2 to bind IAb/3K
For the A) B3K506, B) 2W20 and C) YAe62 TCRs the atom-to-atom contacts between the CDR1 and CDR2 regions of the TCR Vα and Vβ chains and IAb were calculated as described in the Experimental Procedures. The data are shown as the percent of the total CDR1/2 contacts contributed by each TCR amino acid. The sequences of the CDRs are shown with the contact data for each amino acid presented as the percentage of the total Vα/Vβ CDR1/CDR2 contacts. Bars are colored green (Vα CDR1), cyan (Vα CDR2), yellow (Vβ CDR1) and orange (Vβ CDR2), except the bar for Vα 29Y (A and C) or 27S/30D (B) are colored dark green and the bars for Vβ 48Y and 54E (A,B,C) are colored red. In each panel the Vα and Vβ element used by the TCR is indicated.
Figure 5
Figure 5. Vα 29Y and Vβ 48Y and 54E interact with conserved sites on MHCII
The sites of interaction of the Vα CDR1 loop with the IAb β chain helix is shown for the A) B3K506, B) 2W20 and C) YAe62 TCRs. A stick representation of the side chain of Vα[ CDR1 29Y (A and C)) and 27S/30D (B) is shown (carbon colored green and oxygen colored red) with a ribbon representation of a portion of the IAb β chain helix (magenta) and stick representations of the side chains of the relevant IAb amino acids (CPK coloring). Similarly, the sites of interaction of Vβ 48Y and 54E with the IAb α chain is shown for the D) B3K506, E) 2W20 and F) YAe62 TCRs. Stick representations of the side chains of Vα 48Y and 54E are shown (carbon colored orange, oxygen colored red) with a ribbon representation of a portion of the IAb α chain helix and a tube representation of a portion of the loop connecting the 3rd and 4th β strands of the α chain (cyan) and stick representation of the side chains of the relevant IAb amino acids (CPK coloring).
Figure 6
Figure 6. Variable but frequent use of Vα 29Y and Vβ 48Y and 54E in other TCR/MHCII complexes
The CDR1/2 contact data for 5 published TCR/MHCII complex structures involving Vα 29Y or 27S/30D and/or Vβ 48Y and 54E were calculated, labeled, presented and colored as in Figure 4. A) TCR – 3A6, ligand – HLA-DR51 + peptide from myelin basic protein (MBP), PDB – 1ZGL (Li et al., 2005); B) TCR- 1934, ligand -mouse IAu + peptide from MBP;PDB – 2PXY (Feng et al., 2007); C) TCR – 172, ligand, mouse IAu + peptide from MBP;PDB – 1U3H (Maynard et al., 2005); D) TCR –D10, ligand – IAk + peptide from hen conalbumin (ConAlb), PBD – 1D9K (Reinherz et al., 1999) and E) TCR – HA-1.7, ligand – HLA-DR1 + peptide from influenza hemagglutinin (Flu-HA), PDB – 1FYT (Hennecke et al., 2000).
Figure 7
Figure 7. The evolutionarily conserved, MHC binding amino acids affect TCR reaction with self and allo-MHC
T cell hybridomas were constructed to express the wild type YAe62 TCR, or the YAe62 TCR with CDR1α 29Y mutated to A, or CDR2β 48Y or 54E mutated to A. All hybridomas expressed equivalent levels of TCR. The hybridomas were tested for their response to fibroblasts expressing B7, ICAM-1 and IAb/3K or to spleen cells expressing the indicated H-2 alleles bound to mouse peptides. Responses were measured using an HT-2 assay, as units/ml of IL-2 produced. Results shown are the averages and standard errors of 3 independent experiments. The limit of detection in the assays (dotted line) was 2 units/ml of IL-2.
Figure 8
Figure 8. The evolutionarily conserved, MHC binding amino acids impose diagonal binding of the TCR on MHCII
A ribbon representation of the α1 (cyan), β1(magenta) and peptide (yellow) portion of IAb/3K is shown. The sidechains of Vα 29Y (carbon-green and oxygen-red) and Vβ 48Y and 54E (carbon – orange and oxygen – red) of the YAe62 TCR and 27S/30D of the 2W20are shown. A red dotted line represents the central axis of the YAe62 TCR through the CDR regions (Vβ CDR2, Vα CDR3 and Vα CDR1, below and Vβ CDR1, Vβ CDR3 and Vα CDR2, above).

References

    1. Arden B, Clark SP, Kabelitz D, Mak TW. Mouse T-cell receptor variable gene segment families. Immunogenetics. 1995;42:501–530. - PubMed
    1. Ashton-Rickardt PG, Bandeira A, Delaney JR, Van Kaer L, Pircher HP, Zinkernagel RM, Tonegawa S. Evidence for a differential avidity model of T cell selection in the thymus. Cell. 1994;76:651–663. - PubMed
    1. Blackman M, Yague J, Kubo R, Gay D, Coleclough C, Palmer E, Kappler J, Marrack P. The T cell repertoire may be biased in favor of MHC recognition. Cell. 1986;47:349–357. - PubMed
    1. Bluthmann H, Kisielow P, Uematsu Y, Malissen M, Krimpenfort P, Berns A, von Boehmer H, Steinmetz M. T-cell-specific deletion of T-cell receptor transgenes allows functional rearrangement of endogenous alpha- and beta-genes. Nature. 1988;334:156–159. - PubMed
    1. Brunger AT, Adams PD, Clore GM, DeLano WL, Gros P, Grosse-Kunstleve RW, Jiang JS, Kuszewski J, Nilges M, Pannu NS, et al. Crystallography & NMR system: A new software suite for macromolecular structure determination. Acta Crystallogr D Biol Crystallogr. 1998;54 ( Pt 5):905–921. - PubMed

Publication types

MeSH terms

Substances