. 2008 May 1;586(9):2277-91.
doi: 10.1113/jphysiol.2007.149021. Epub 2008 Feb 28.

Metabotropic glutamate receptors activate dendritic calcium waves and TRPM channels which drive rhythmic respiratory patterns in mice

Affiliations

Metabotropic glutamate receptors activate dendritic calcium waves and TRPM channels which drive rhythmic respiratory patterns in mice

S L Mironov. J Physiol. .

Abstract

Respiration in vertebrates is generated by a compact network which is located in the lower brainstem but cellular mechanisms which underlie persistent oscillatory activity of the respiratory network are yet unknown. Using two-photon imaging and patch-clamp recordings in functional brainstem preparations of mice containing pre-Bötzinger complex (preBötC), we examined the actions of metabotropic glutamate receptors (mGluR1/5) on the respiratory patterns. The agonist DHPG potentiated and antagonist LY367385 depressed respiration-related activities. In the inspiratory neurons, we observed rhythmic activation of non-selective channels which had a conductance of 24 pS. Their activity was enhanced with membrane depolarization and after elevation of calcium from the cytoplasmic side of the membrane. They were activated by a non-hydrolysable PIP(2) analogue and blocked by flufenamate, ATP4- and Gd3+. All these properties correspond well to those of TRPM4 channels. Calcium imaging of functional slices revealed rhythmic transients in small clusters of neurons present in a network. Calcium transients in the soma were preceded by the waves in dendrites which were dependent on mGluR activation. Initiation and propagation of waves required calcium influx and calcium release from internal stores. Calcium waves activated TPRM4-like channels in the soma and promoted generation of inspiratory bursts. Simulations of activity of neurons communicated via dendritic calcium waves showed emerging activity within neuronal clusters and its synchronization between the clusters. The experimental and theoretical data provide a subcellular basis for a recently proposed group-pacemaker hypothesis and describe a novel mechanism of rhythm generation in neuronal networks.


Figures

Figure 1
Figure 1. Experimental protocols applied in the present study
A, DIC image illustrating local applications in slices. The perfusion pipette was first placed over the dendrite in the vicinity of its branching point (as shown in top inset in the DIC image) and then repositioned close to the soma (the second image). Calcium currents (holding potential −60 mV, voltage steps to 0 mV) were measured before, 6 and 20 s after starting perfusion with 0.2 mm Cd2+. Note the absence of effects when the pipette was about 60 μm away from the soma (three traces superimposed) and a decrease in current when the pipette was close to the soma. B, respiratory motor output (∫XII) and the membrane current (Im). In this cell-attached configuration the action potentials were directed upward and channel openings were directed downward. The next trace shows the channel activity after APs were subtracted and the lowermost trace presents the mean open probability calculated as a moving average (window, 100 ms).
Figure 5
Figure 5. preBötC neurons in primary culture
A, staining for 5-HT-4a receptors (green) and MAP2 (red). B, staining for NK-1 (green) and μ-opioid receptors (red). C, cluster of active respiratory neurons. D, calcium changes. Multicoloured traces correspond to ROIs indicated in C. A sample trial is presented in Supplementary Movie 3. E, calcium transients in the cell soma and membrane current measured at the holding potential −40 mV. Scale bars in all panels, 20 μm.
Figure 3
Figure 3. TRPM4-like channels in the inspiratory neurons and their modulation
A, first panel shows potentiation of channel activity during application of negative pressure to the cell-attached patch. The two panels below present I–V relationship and modulation of channel activity in the inside-out patches in bath solution contained 0.3 μm Ca2+. The middle panel shows open channel probability at different potentials (mean ±s.e.m.) and changes in single-channel current during the voltage-ramp that correspond to the mean channel conductance 24 pS. Application of 10 μm flufenamate and 19 μm ATP4− to the cytoplasmic side inhibited channel activity (holding potential, +50 mV), and it was augmented 2 min after addition of 10 μm non-hydrolysable DiC8PIP2 or 10 μm Ca2+ to the bathing solution. B, representative recordings show the activity of TRPM4-like channels in cell-attached patches in the control, 2 min after addition of 10 μm DHPG to the bath, and 10 min after subsequent addition of 300 μm flufenamate. Note differences in acting concentrations of flufenamate in inside-out and cell-attached patches that indicate its intracellular action.
Figure 2
Figure 2. Group I metabotropic glutamate receptors in the respiratory network
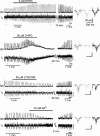
Traces in left panel show the actions of mGluR1/5 agonist (DHPG), antagonist (LY367385), and Gd3+ (applied to block TRPM4-like channels) on the respiratory motor output (∫XII) and membrane current (Im) recorded in the inspiratory neurons in the perforated patch-clamp mode (holding potential, −40 mV). The drugs were washed out for the periods indicated, and the initial activity was restored (note the compressed time-scale in the presentation). The episodes indicated by asterisks in the Im trace show inspiratory drive currents at the expanded time-scale of the right.
Figure 4
Figure 4. Two-photon [Ca2+]i imaging of persistent oscillatory activity in respiratory neurons
A, spatial and temporal correlations of the rhythmic cell activity in the functionally intact preparation. Top left inset shows representative distribution of active cells in a network and the right inset presents the histogram of distances between them. In the rasterplot below each row corresponds to a single cell, and each mark to a detected [Ca2+]i transient. A histogram below gives the number of cells active at each frame recorded that correlates with the respiratory motor output in the lowermost trace. A sample trial is presented in Supplementary Movie 1. B, main types of spontaneous transients in slices. C, spontaneous activity in clusters of neurons in the functional slice preparation and its modulation. The insets in each panel show halftone images of neuronal clusters and the triangles at image borders indicate the positions of perfusion pipette for drug applications. Scale bars in all insets, 20 μm. The traces were obtained in dendrites (black curves) and in the soma of neurons (grey curves). All effects were reversible and the activity was restored after the drug was washed out (restoration of activity took different times and it is presented at the compressed time scale). The first experiment with thapsigargin is also presented in Supplementary Movie 2.
Figure 6
Figure 6. Correlation between bursting activity and calcium waves
A, calcium waves, bursting and channel activity in the functionally intact preparation. Top, overlay of fluo-3 fluorescence (red, sampling interval, 0.3 s) and DIC image (green). The fluorescence scans below were obtained along curvilinear path as indicated by the white line in the first frame. Time counts begin from the appearance of the wave in dendrite and differently coloured profiles are positioned above respective parts of the cell-attached patch-clamp recordings. Note that the calcium wave first appeared at the dendritic branching point, propagated across the soma and invaded the opposite dendrite. Distances between the wave fronts corresponded to the mean wave velocity, 72 μm s−1. A sample trial is presented in Supplementary Movie 4. Note an increase in channel activity when the wave arrived at the soma after which the burst of action potentials was generated. After control measurements, 5 μm DHPG was added to the bath to activate metabotropic glutamate receptors and 2 min after, the recordings were made. Note that in the presence of DHPG, the wave propagated faster (the velocity increased to 100 μm s−1) and the burst lasted longer. The next recording was made 10 min after DHPG was washed out with a fresh solution containing 300 μm flufenamate. The wave velocity (72 μm s−1) was similar to that in the control, but the activity of the channels significantly diminished and the burst duration was much reduced. B, calcium waves, channel and bursting activities in cultured preBötC neurons at 16 DIV, which showed no spontaneous activity in the standard ACSF containing 3 mm[K+]o. Top left, propagating [Ca2+]i wave triggered by a puff of high-K+ solution onto the left neuron in the inset (the temporal and spatial widths of the application spot were 0.1 s and 5 μm, respectively). The wave speed (71 μm s−1) was obtained from the calcium profiles measured along the white line in the DIC image (the arrows indicate the locations of peaks). Lower pairs of traces were recorded 1 min after addition of 10 μm CNQX (AMPAR antagonist) to the bath. Note that although in this case [Ca2+]i showed increase near the stimulation site, the transient did not propagate. The right panel shows activation of TRPM4-like channels and burst of action potentials due to stimulation. The rightmost trace was obtained after elevating bath [K+]o to 7 mm, after which spontaneous transients appeared and they were similar to the evoked responses. C, calcium waves induced by local depolarization of distant dendrite. DIC image in the inset shows the positions of stimulation and perfusion pipettes. Calculated wave speed, 70 μm s−1. Application of thapsigargin (Tg, 1 μm) in the middle of dendrite locally elevated calcium, that inhibited wave propagation. After washing out thapsigargin, [K+]o was increased from 3 to 7 mm, that induced spontaneous [Ca2+]i spikes which spread out in the dendrite at a velocity of 67 μm s−1. Scale bars in all panels, 20 μm.
Figure 7
Figure 7. Modelling
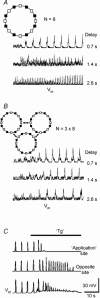
Simulations were performed using the model described in Methods. The insets in A and B show configurations used. They included excitability sites (empty squares), which were connected with each other and to the neurons (filled squares). Delays in the propagation of calcium waves between the sites are given near each trace. In neurons, calcium elevations activated TRPM4-like channels that produced suprathreshold membrane depolarizations. Population activities were calculated as mean voltage within a cluster. A and B show representative simulations for a ring of eight neurons and three interconnected rings, respectively. C shows the effects of local application of thapsigargin (TG) to one site in the ring of eight neurons (delay, 0.7 s). The activity was first enhanced due to Ca2+ release from ER and then subsided after its depletion.

Comment in

Similar articles

Cited by

References

    1. Augustine GJ, Santamaria F, Tanaka K. Local calcium signaling in neurons. Neuron. 2003;40:331–346. - PubMed
    1. Baker RE, Ballantyne D, Bingmann D, Jones D, Widman G. Rhythm generation in medullary cultures of newborn rats. Int J Dev Neurosci. 1995;13:799–809. - PubMed
    1. Busselberg D, Bischoff AM, Richter DW. A combined blockade of glycine and Ca2+-dependent K+ channels abolishes respiratory rhythm. Neuroscience. 2003;122:831–841. - PubMed
    1. Butera RJ, Rinzel J, Smith JC. Models of respiratory rhythm generation in the pre-Botzinger complex. I. Bursting pacemaker neurons. J Neurophysiol. 1999;82:382–397. - PubMed
    1. Campbell CG, Spray DC, Wolkoff AW. Extracellular ATP4− modulates organic anion transport by rat hepatocytes. J Biol Chem. 1993;268:15399–15404. - PubMed

Substances

LinkOut - more resources