

Metabolic and endocrine profiles in response to systemic infusion of fructose and glucose in rhesus macaques
- PMID: 18308841
- PMCID: PMC2408804
- DOI: 10.1210/en.2007-1812
Metabolic and endocrine profiles in response to systemic infusion of fructose and glucose in rhesus macaques
Abstract
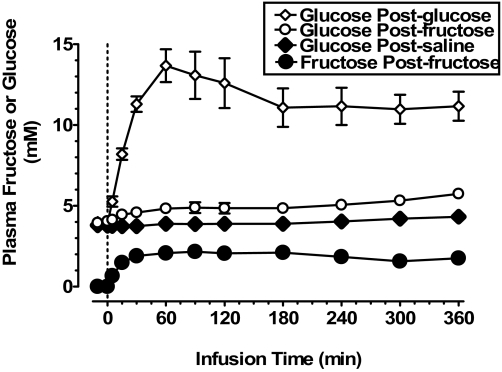
Diurnal patterns of circulating leptin concentrations are attenuated after consumption of fructose-sweetened beverages compared with glucose-sweetened beverages, likely a result of limited postprandial glucose and insulin excursions after fructose. Differences in postprandial exposure of adipose tissue to peripheral circulating fructose and glucose or in adipocyte metabolism of the two sugars may also be involved. Thus, we compared plasma leptin concentrations after 6-h iv infusions of saline, glucose, or fructose (15 mg/kg.min) in overnight-fasted adult rhesus monkeys (n = 9). Despite increases of plasma fructose from undetectable levels to about 2 mm during fructose infusion, plasma leptin concentrations did not increase, and the change of insulin was only about 10% of that seen during glucose infusion. During glucose infusion, plasma leptin was significantly increased above baseline concentrations by 240 min and increased steadily until the final 480-min time point (change in leptin = +2.5 +/- 0.9 ng/ml, P < 0.001 vs. saline; percent change in leptin = +55 +/- 16%; P < 0.005 vs. saline). Substantial anaerobic metabolism of fructose was suggested by a large increase of steady-state plasma lactate (change in lactate = 1.64 +/- 0.15 mm from baseline), which was significantly greater than that during glucose (+0.53 +/- 0.14 mm) or saline (-0.51 +/- 0.14 mm) infusions (P < 0.001). Therefore, increased adipose exposure to fructose and an active whole-body anaerobic fructose metabolism are not sufficient to increase circulating leptin levels in rhesus monkeys. Thus, additional factors (i.e. limited post-fructose insulin excursions and/or hexose-specific differences in adipocyte metabolism) are likely to underlie disparate effects of fructose and glucose to increase circulating leptin concentrations.
Figures


Similar articles
-
Endocrine and metabolic effects of consuming fructose- and glucose-sweetened beverages with meals in obese men and women: influence of insulin resistance on plasma triglyceride responses.J Clin Endocrinol Metab. 2009 May;94(5):1562-9. doi: 10.1210/jc.2008-2192. Epub 2009 Feb 10. J Clin Endocrinol Metab. 2009. PMID: 19208729 Free PMC article. Clinical Trial.
-
Endocrine and metabolic effects of consuming beverages sweetened with fructose, glucose, sucrose, or high-fructose corn syrup.Am J Clin Nutr. 2008 Dec;88(6):1733S-1737S. doi: 10.3945/ajcn.2008.25825D. Am J Clin Nutr. 2008. PMID: 19064538 Free PMC article. Review.
-
Dietary fructose reduces circulating insulin and leptin, attenuates postprandial suppression of ghrelin, and increases triglycerides in women.J Clin Endocrinol Metab. 2004 Jun;89(6):2963-72. doi: 10.1210/jc.2003-031855. J Clin Endocrinol Metab. 2004. PMID: 15181085 Clinical Trial.
-
Effects of sugar-sweetened beverages on plasma acylation stimulating protein, leptin and adiponectin: relationships with metabolic outcomes.Obesity (Silver Spring). 2013 Dec;21(12):2471-80. doi: 10.1002/oby.20437. Epub 2013 Jun 13. Obesity (Silver Spring). 2013. PMID: 23512943 Free PMC article.
-
Peripheral signals conveying metabolic information to the brain: short-term and long-term regulation of food intake and energy homeostasis.Exp Biol Med (Maywood). 2001 Dec;226(11):963-77. doi: 10.1177/153537020122601102. Exp Biol Med (Maywood). 2001. PMID: 11743131 Review.
Cited by
-
The fructose-fed rat: a review on the mechanisms of fructose-induced insulin resistance and hypertension.Mol Cell Biochem. 2009 Dec;332(1-2):145-59. doi: 10.1007/s11010-009-0184-4. Epub 2009 Jun 18. Mol Cell Biochem. 2009. PMID: 19536638 Review.
-
Fructose-fed rhesus monkeys: a nonhuman primate model of insulin resistance, metabolic syndrome, and type 2 diabetes.Clin Transl Sci. 2011 Aug;4(4):243-52. doi: 10.1111/j.1752-8062.2011.00298.x. Clin Transl Sci. 2011. PMID: 21884510 Free PMC article.
-
High-fructose corn syrup causes characteristics of obesity in rats: increased body weight, body fat and triglyceride levels.Pharmacol Biochem Behav. 2010 Nov;97(1):101-6. doi: 10.1016/j.pbb.2010.02.012. Epub 2010 Feb 26. Pharmacol Biochem Behav. 2010. PMID: 20219526 Free PMC article.
-
Use and Importance of Nonhuman Primates in Metabolic Disease Research: Current State of the Field.ILAR J. 2017 Dec 1;58(2):251-268. doi: 10.1093/ilar/ilx031. ILAR J. 2017. PMID: 29216341 Free PMC article. Review.
-
Comparative effects of fructose and glucose on lipogenic gene expression and intermediary metabolism in HepG2 liver cells.PLoS One. 2011;6(11):e26583. doi: 10.1371/journal.pone.0026583. Epub 2011 Nov 11. PLoS One. 2011. PMID: 22096489 Free PMC article.
References
-
- Havel PJ 2005 Dietary fructose: implications for dysregulation of energy homeostasis and lipid/carbohydrate metabolism. Nutr Rev 63:133–157 - PubMed
-
- Popkin BM, Armstrong LE, Bray GM, Caballero B, Frei B, Willett WC 2006 A new proposed guidance system for beverage consumption in the United States. Am J Clin Nutr 83:529–542 - PubMed
-
- Bray GA, Nielsen SJ, Popkin BM 2004 Consumption of high-fructose corn syrup in beverages may play a role in the epidemic of obesity. Am J Clin Nutr 79:537–543 - PubMed
Publication types
MeSH terms
Substances
Grants and funding
- R21 AT002599/AT/NCCIH NIH HHS/United States
- P51 RR000169/RR/NCRR NIH HHS/United States
- AT-003645/AT/NCCIH NIH HHS/United States
- RR-00169/RR/NCRR NIH HHS/United States
- R21 AT002993/AT/NCCIH NIH HHS/United States
- R01 HL075675/HL/NHLBI NIH HHS/United States
- HL-075675/HL/NHLBI NIH HHS/United States
- R01 HL091333/HL/NHLBI NIH HHS/United States
- R21 AT003645/AT/NCCIH NIH HHS/United States
- AT-002599/AT/NCCIH NIH HHS/United States
- HL-091333/HL/NHLBI NIH HHS/United States
- DK-50129/DK/NIDDK NIH HHS/United States
- AT002993/AT/NCCIH NIH HHS/United States
- ImNIH/Intramural NIH HHS/United States
