

Development of bottom-fermenting saccharomyces strains that produce high SO2 levels, using integrated metabolome and transcriptome analysis
- PMID: 18310411
- PMCID: PMC2394901
- DOI: 10.1128/AEM.01781-07
Development of bottom-fermenting saccharomyces strains that produce high SO2 levels, using integrated metabolome and transcriptome analysis
Abstract
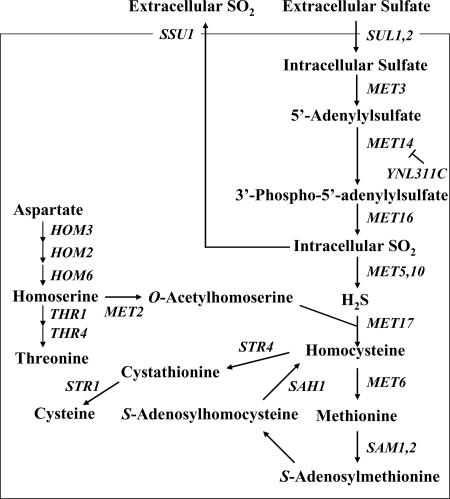
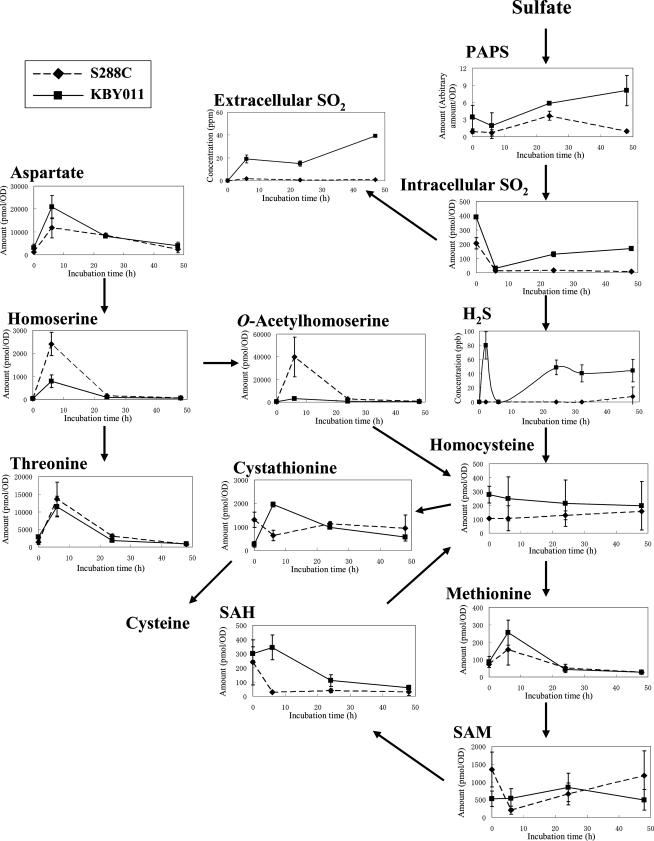
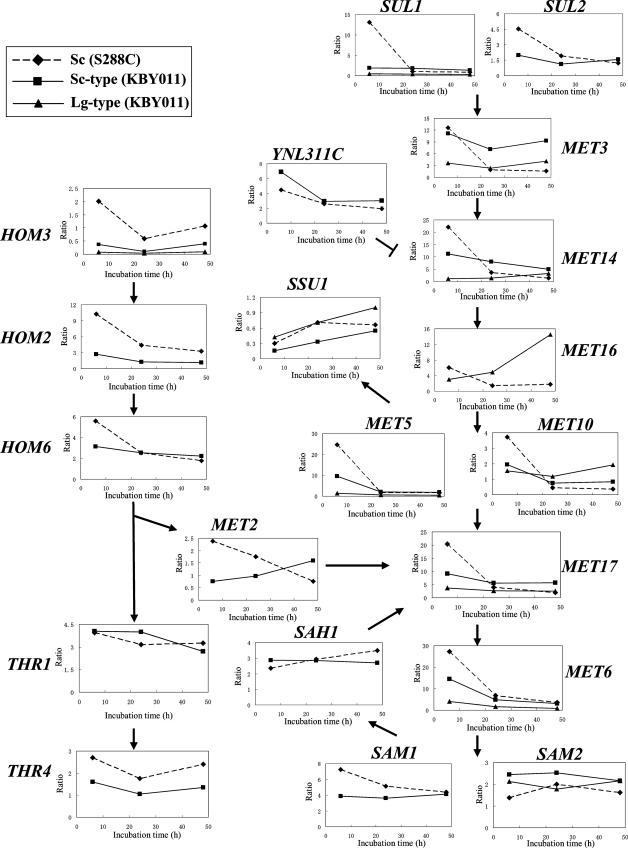
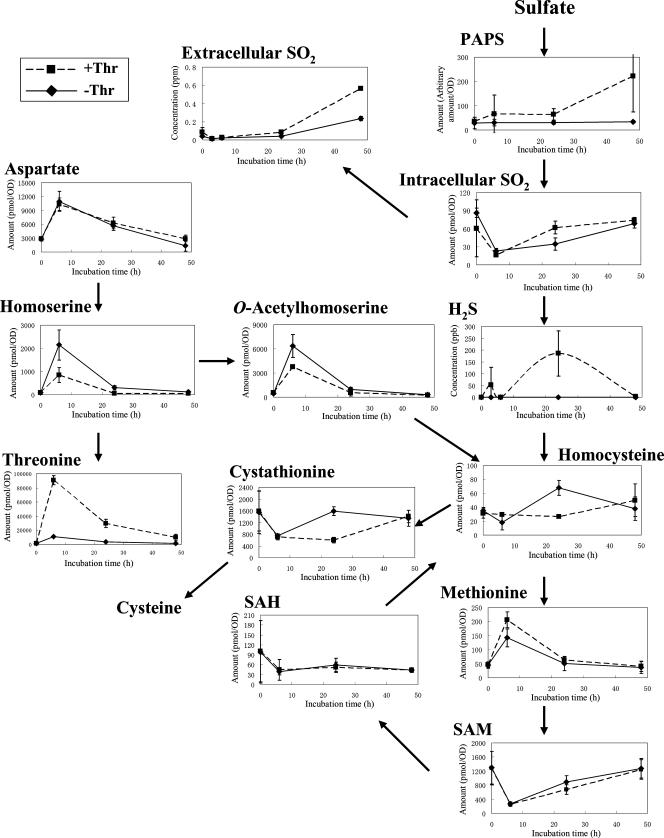
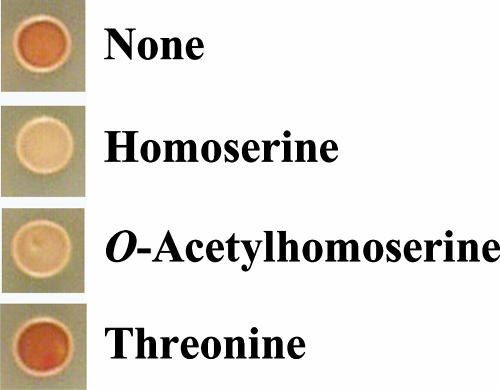
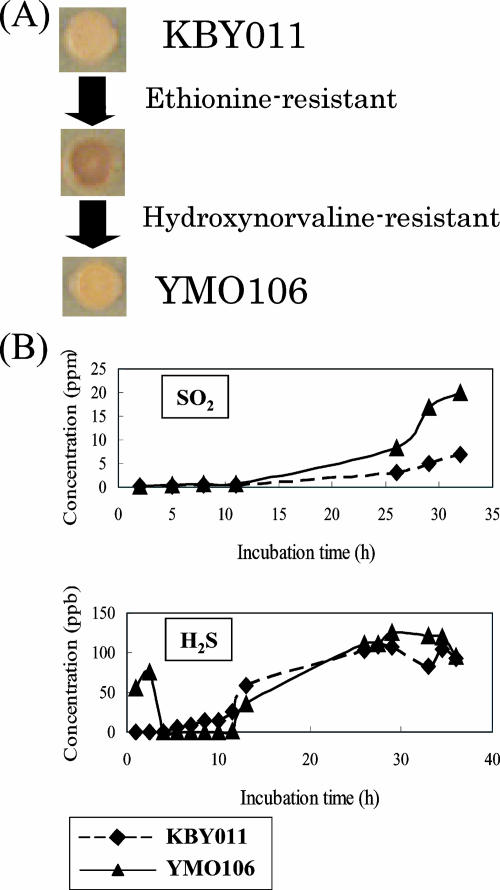
Sulfite plays an important role in beer flavor stability. Although breeding of bottom-fermenting Saccharomyces strains that produce high levels of SO(2) is desirable, it is complicated by the fact that undesirable H(2)S is produced as an intermediate in the same pathway. Here, we report the development of a high-level SO(2)-producing bottom-fermenting yeast strain by integrated metabolome and transcriptome analysis. This analysis revealed that O-acetylhomoserine (OAH) is the rate-limiting factor for the production of SO(2) and H(2)S. Appropriate genetic modifications were then introduced into a prototype strain to increase metabolic fluxes from aspartate to OAH and from sulfate to SO(2), resulting in high SO(2) and low H(2)S production. Spontaneous mutants of an industrial strain that were resistant to both methionine and threonine analogs were then analyzed for similar metabolic fluxes. One promising mutant produced much higher levels of SO(2) than the parent but produced parental levels of H(2)S.
Figures
Similar articles
-
A novel mechanism regulates H(2) S and SO(2) production in Saccharomyces cerevisiae.Yeast. 2011 Feb;28(2):109-21. doi: 10.1002/yea.1823. Epub 2010 Oct 8. Yeast. 2011. PMID: 20936605
-
[Construction of high sulphite-producing industrial strain of Saccharomyces cerevisiae].Wei Sheng Wu Xue Bao. 2006 Feb;46(1):38-42. Wei Sheng Wu Xue Bao. 2006. PMID: 16579462 Chinese.
-
Development of Saccharomyces cerevisiae producing higher levels of sulfur dioxide and glutathione to improve beer flavor stability.Appl Biochem Biotechnol. 2012 Jan;166(2):402-13. doi: 10.1007/s12010-011-9436-3. Epub 2011 Nov 12. Appl Biochem Biotechnol. 2012. PMID: 22081326
-
Identification by comparative transcriptomics of core regulatory genes for higher alcohol production in a top-fermenting yeast at different temperatures in beer fermentation.Appl Microbiol Biotechnol. 2019 Jun;103(12):4917-4929. doi: 10.1007/s00253-019-09807-x. Epub 2019 May 9. Appl Microbiol Biotechnol. 2019. PMID: 31073877
-
Sulfate transport mutants affect hydrogen sulfide and sulfite production during alcoholic fermentation.Yeast. 2021 Jun;38(6):367-381. doi: 10.1002/yea.3553. Epub 2021 Mar 1. Yeast. 2021. PMID: 33560525
Cited by
-
Metabolic pathway engineering based on metabolomics confers acetic and formic acid tolerance to a recombinant xylose-fermenting strain of Saccharomyces cerevisiae.Microb Cell Fact. 2011 Jan 10;10(1):2. doi: 10.1186/1475-2859-10-2. Microb Cell Fact. 2011. PMID: 21219616 Free PMC article.
-
Sterol side chain reductase 2 is a key enzyme in the biosynthesis of cholesterol, the common precursor of toxic steroidal glycoalkaloids in potato.Plant Cell. 2014 Sep;26(9):3763-74. doi: 10.1105/tpc.114.130096. Epub 2014 Sep 12. Plant Cell. 2014. PMID: 25217510 Free PMC article.
-
Identification of new Saccharomyces cerevisiae variants of the MET2 and SKP2 genes controlling the sulfur assimilation pathway and the production of undesirable sulfur compounds during alcoholic fermentation.Microb Cell Fact. 2015 May 8;14:68. doi: 10.1186/s12934-015-0245-1. Microb Cell Fact. 2015. PMID: 25947166 Free PMC article.
-
Secretion expression of SOD1 and its overlapping function with GSH in brewing yeast strain for better flavor and anti-aging ability.J Ind Microbiol Biotechnol. 2014 Sep;41(9):1415-24. doi: 10.1007/s10295-014-1481-9. Epub 2014 Jul 19. J Ind Microbiol Biotechnol. 2014. PMID: 25037722
-
Systematic applications of metabolomics in metabolic engineering.Metabolites. 2012 Dec 14;2(4):1090-122. doi: 10.3390/metabo2041090. Metabolites. 2012. PMID: 24957776 Free PMC article.
References
-
- Aharoni, A., C. H. R. de Vos, H. A. Verhoeven, C. A. Maliepaard, G. Kruppa, R. Bino, and D. B. Goodenowe. 2002. Nontargeted metabolome analysis by use of Fourier transform ion cyclotron mass spectrometry. Omics 6:217-234. - PubMed
-
- Bilinski, C. A., I. Russell, and G. G. Stewart. 1987. Physiological requirements for induction of sporulation in lager yeast. J. Inst. Brew. 92:216-219.
-
- Cherest, H., and Y. Surdin-Kerjan. 1978. S-Adenosylmethionine requiring mutants in Saccharomyces cerevisiae: evidences for the existence of two methionine adenosyl transferases. Mol. Gen. Genet. 163:153-167. - PubMed
-
- Donalies, U. E., and U. Stahl. 2002. Increasing sulphite formation in Saccharomyces cerevisiae by overexpression of MET14 and SSU1. Yeast 19:475-484. - PubMed
-
- Duan, W., F. A. Roddick, V. J. Higgins, and P. J. Rogers. 2004. A parallel analysis of H2S and SO2 formation by brewing yeast in response to sulfur-containing amino acids and ammonium ions. J. Am. Soc. Brew. Chem. 62:35-41.
MeSH terms
Substances
LinkOut - more resources
Full Text Sources
Molecular Biology Databases
